QUESTION IMAGE
Question
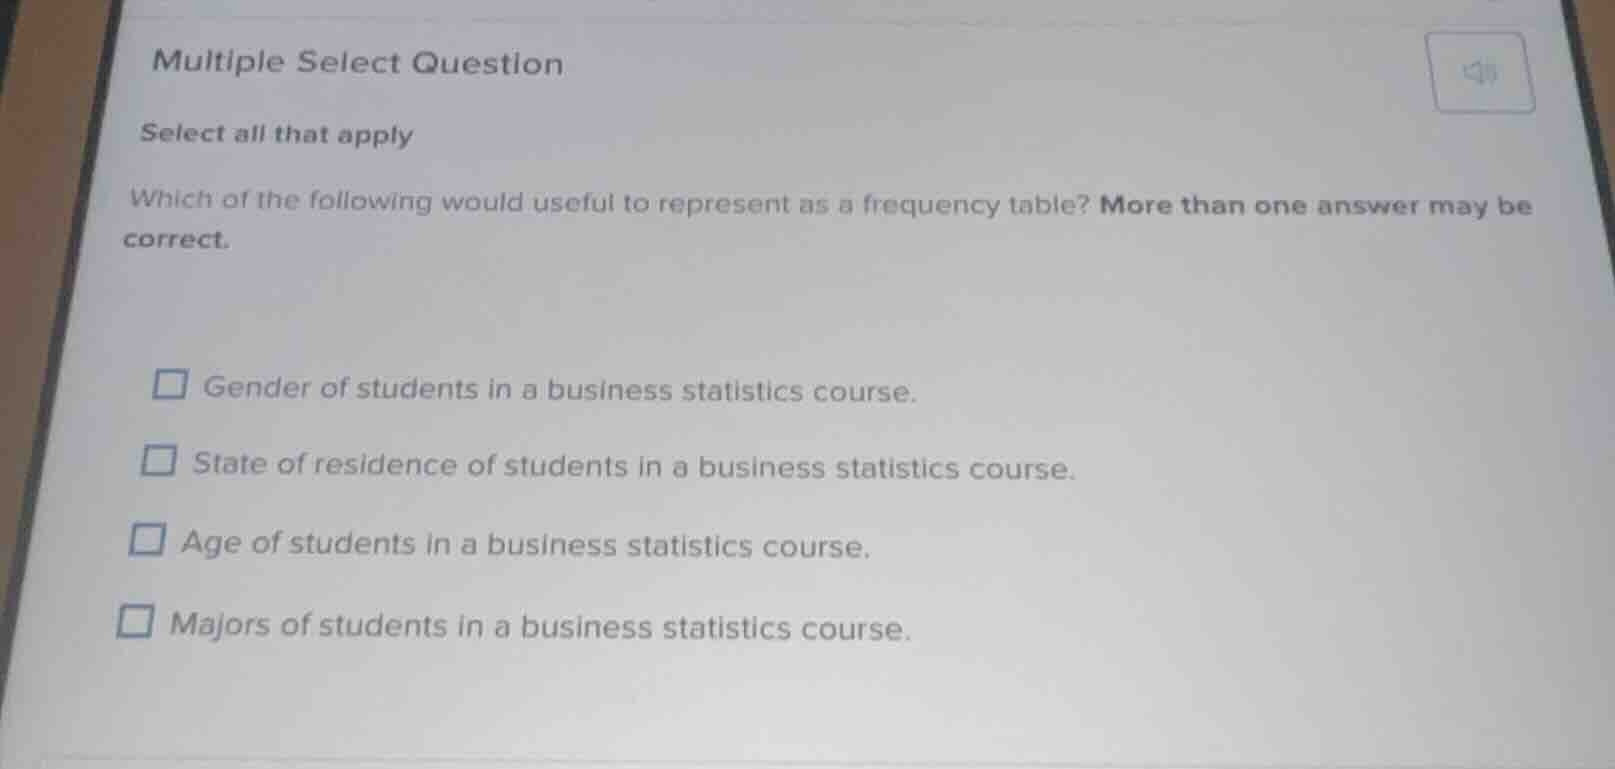
multiple select question
select all that apply
which of the following would useful to represent as a frequency table? more than one answer may be correct.
gender of students in a business statistics course.
state of residence of students in a business statistics course.
age of students in a business statistics course.
majors of students in a business statistics course.
A frequency table is used to count how often categorical or grouped numerical data occurs. Gender, state of residence, and majors are categorical variables, making them ideal for frequency tables. Age is numerical but can be grouped into intervals (e.g., 18-20, 21-23) and also represented in a frequency table to show the distribution of ages. All these variables can benefit from a frequency table to display their occurrence counts.

Snap & solve any problem in the app
Get step-by-step solutions on Sovi AI
Photo-based solutions with guided steps
Explore more problems and detailed explanations
- Gender of students in a business statistics course.
- State of residence of students in a business statistics course.
- Age of students in a business statistics course.
- Majors of students in a business statistics course.