QUESTION IMAGE
Question
name:
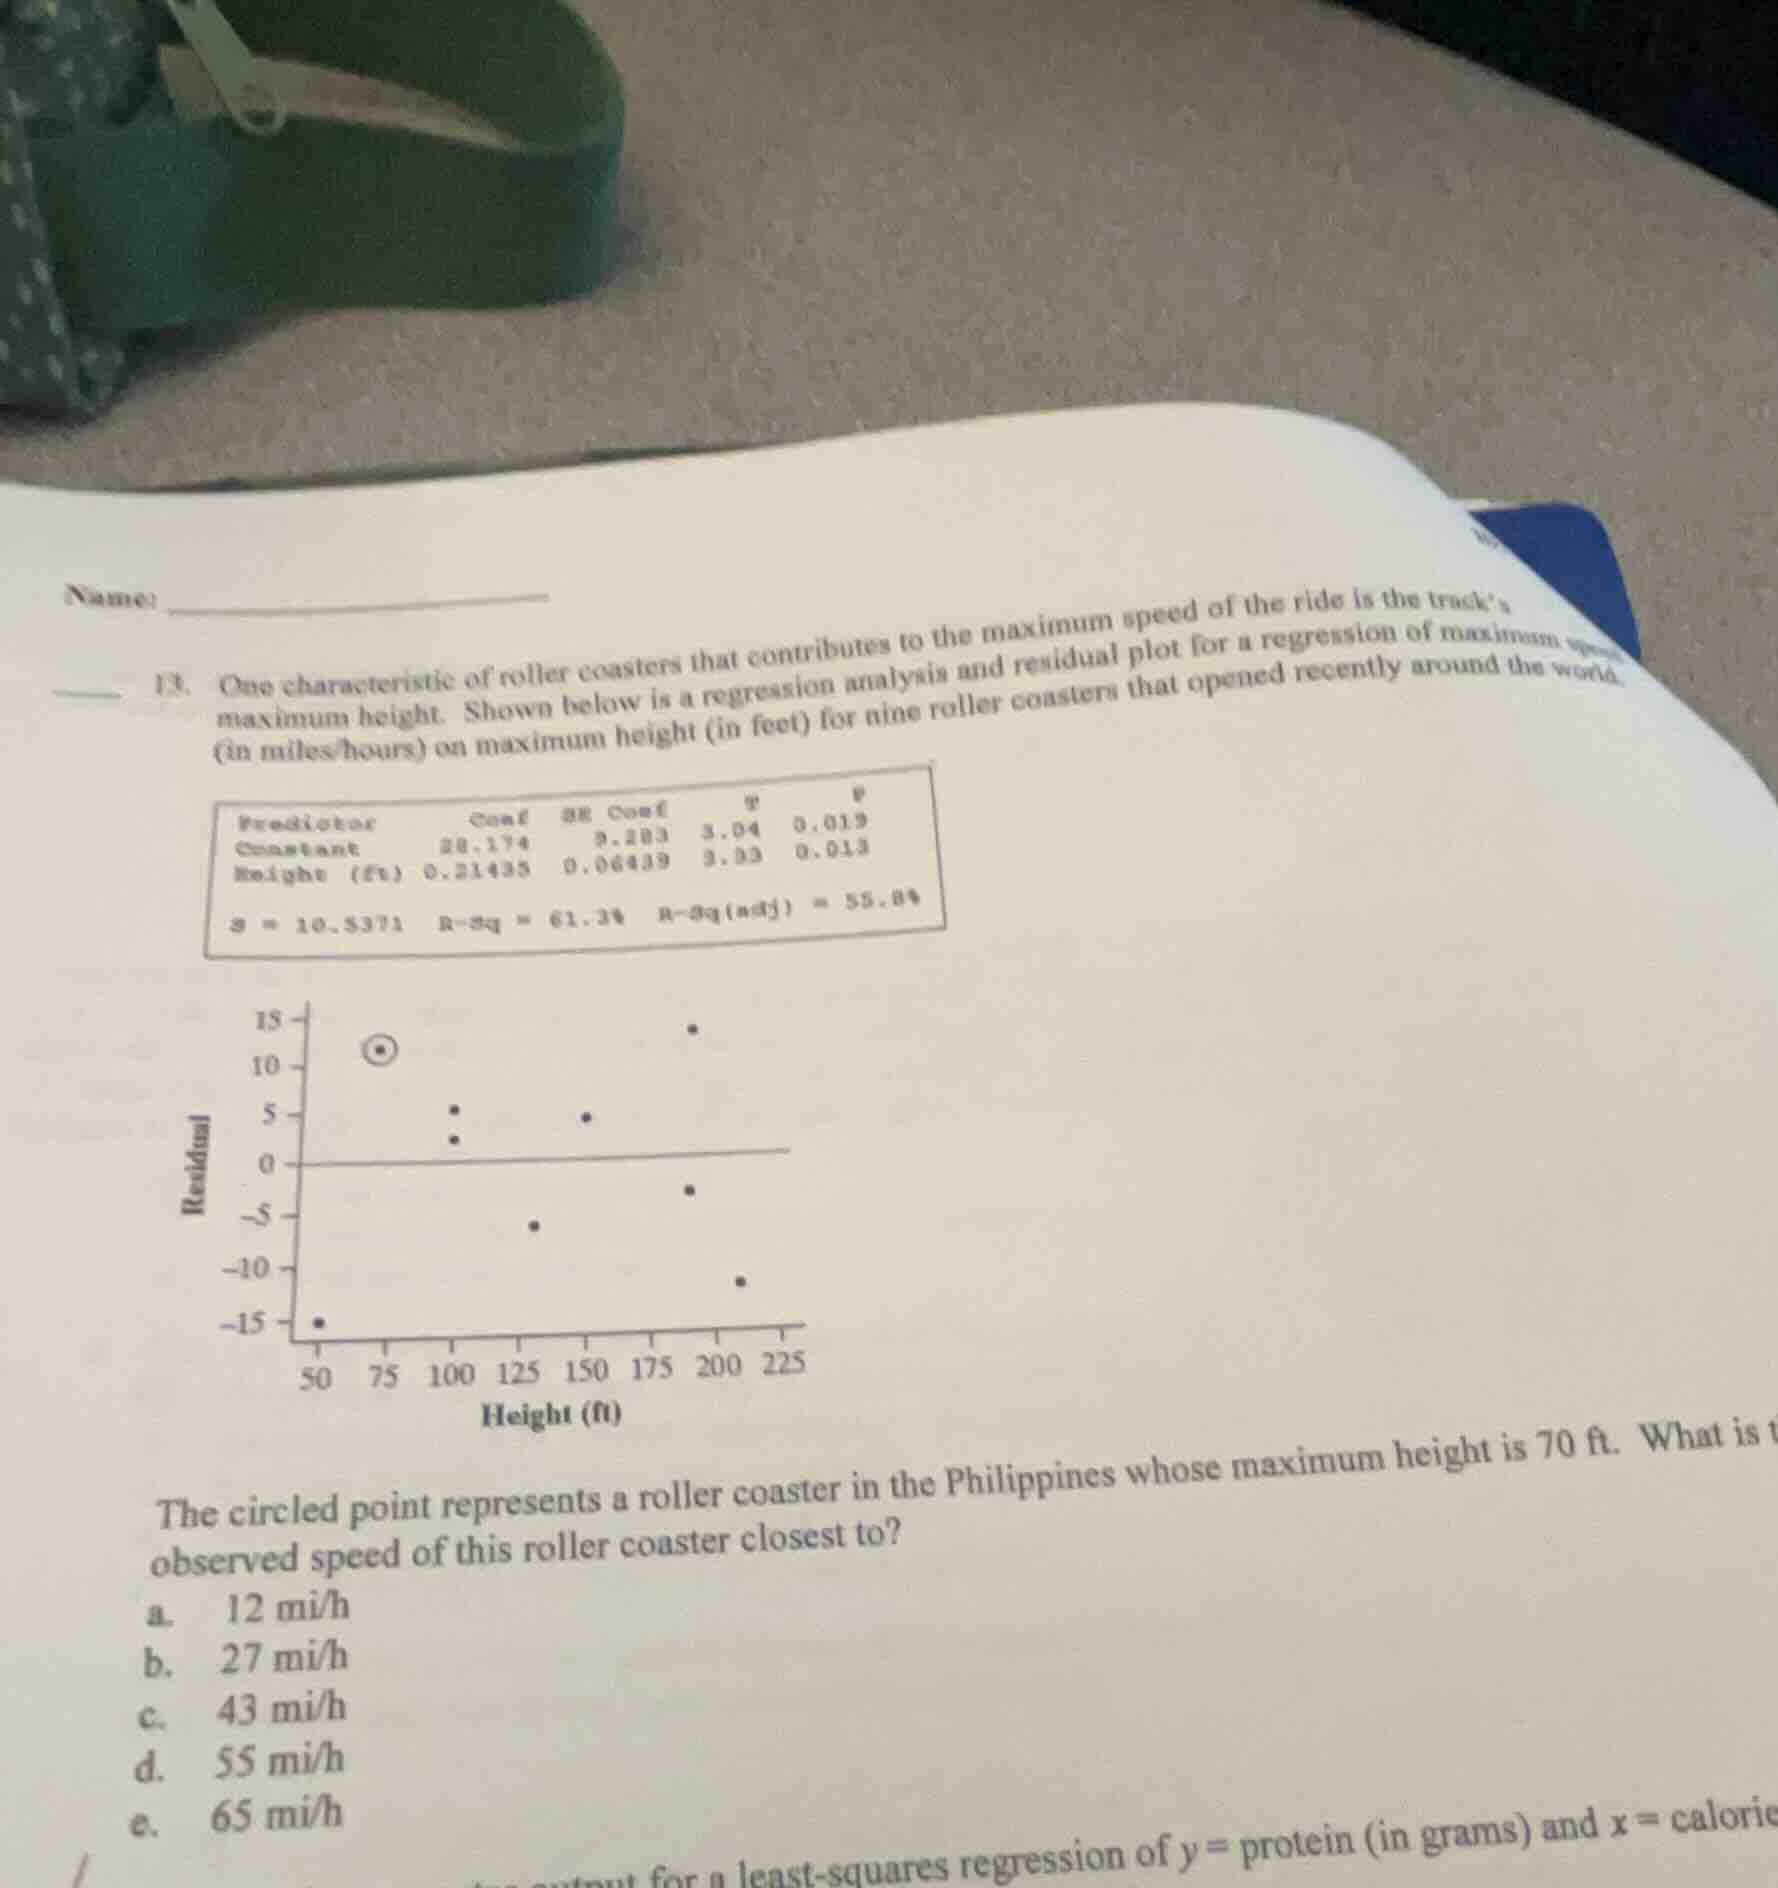
- one characteristic of roller coasters that contributes to the maximum speed of the ride is the tracks maximum height. shown below is a regression analysis and residual plot for a regression of maximum speed (in miles/hours) on maximum height (in feet) for nine roller coasters that opened recently around the world.
regression table and residual plot
the circled point represents a roller coaster in the philippines whose maximum height is 70 ft. what is the observed speed of this roller coaster closest to?
a. 12 mi/h
b. 27 mi/h
c. 43 mi/h
d. 55 mi/h
e. 65 mi/h
Step1: Write regression equation
From the table, the regression equation is:
$\hat{y} = 28.174 + 0.21435x$
where $\hat{y}$ is predicted speed, $x$ is height.
Step2: Calculate predicted speed
Substitute $x=70$ into the equation:
$\hat{y} = 28.174 + 0.21435(70) = 28.174 + 15.0045 = 43.1785$
Step3: Relate residual to observed speed
Residual = Observed - Predicted. From the plot, residual ≈ 12.
$\text{Observed} = \text{Residual} + \hat{y} = 12 + 43.1785 ≈ 55.18$

Snap & solve any problem in the app
Get step-by-step solutions on Sovi AI
Photo-based solutions with guided steps
Explore more problems and detailed explanations
d. 55 mi/h