QUESTION IMAGE
Question
name: _____________ date: __________
- measures of central tendency score __/7 or __%
use this data to answer the questions a, b, c and d.
4, 6, 7, 8, 8, 9, 10
a. what is the mean of the numbers provided? (round to the tenths place.)
b. what is the median of the numbers provided?
c. what is the mode of the numbers provided?
d. what is the range of the numbers provided?
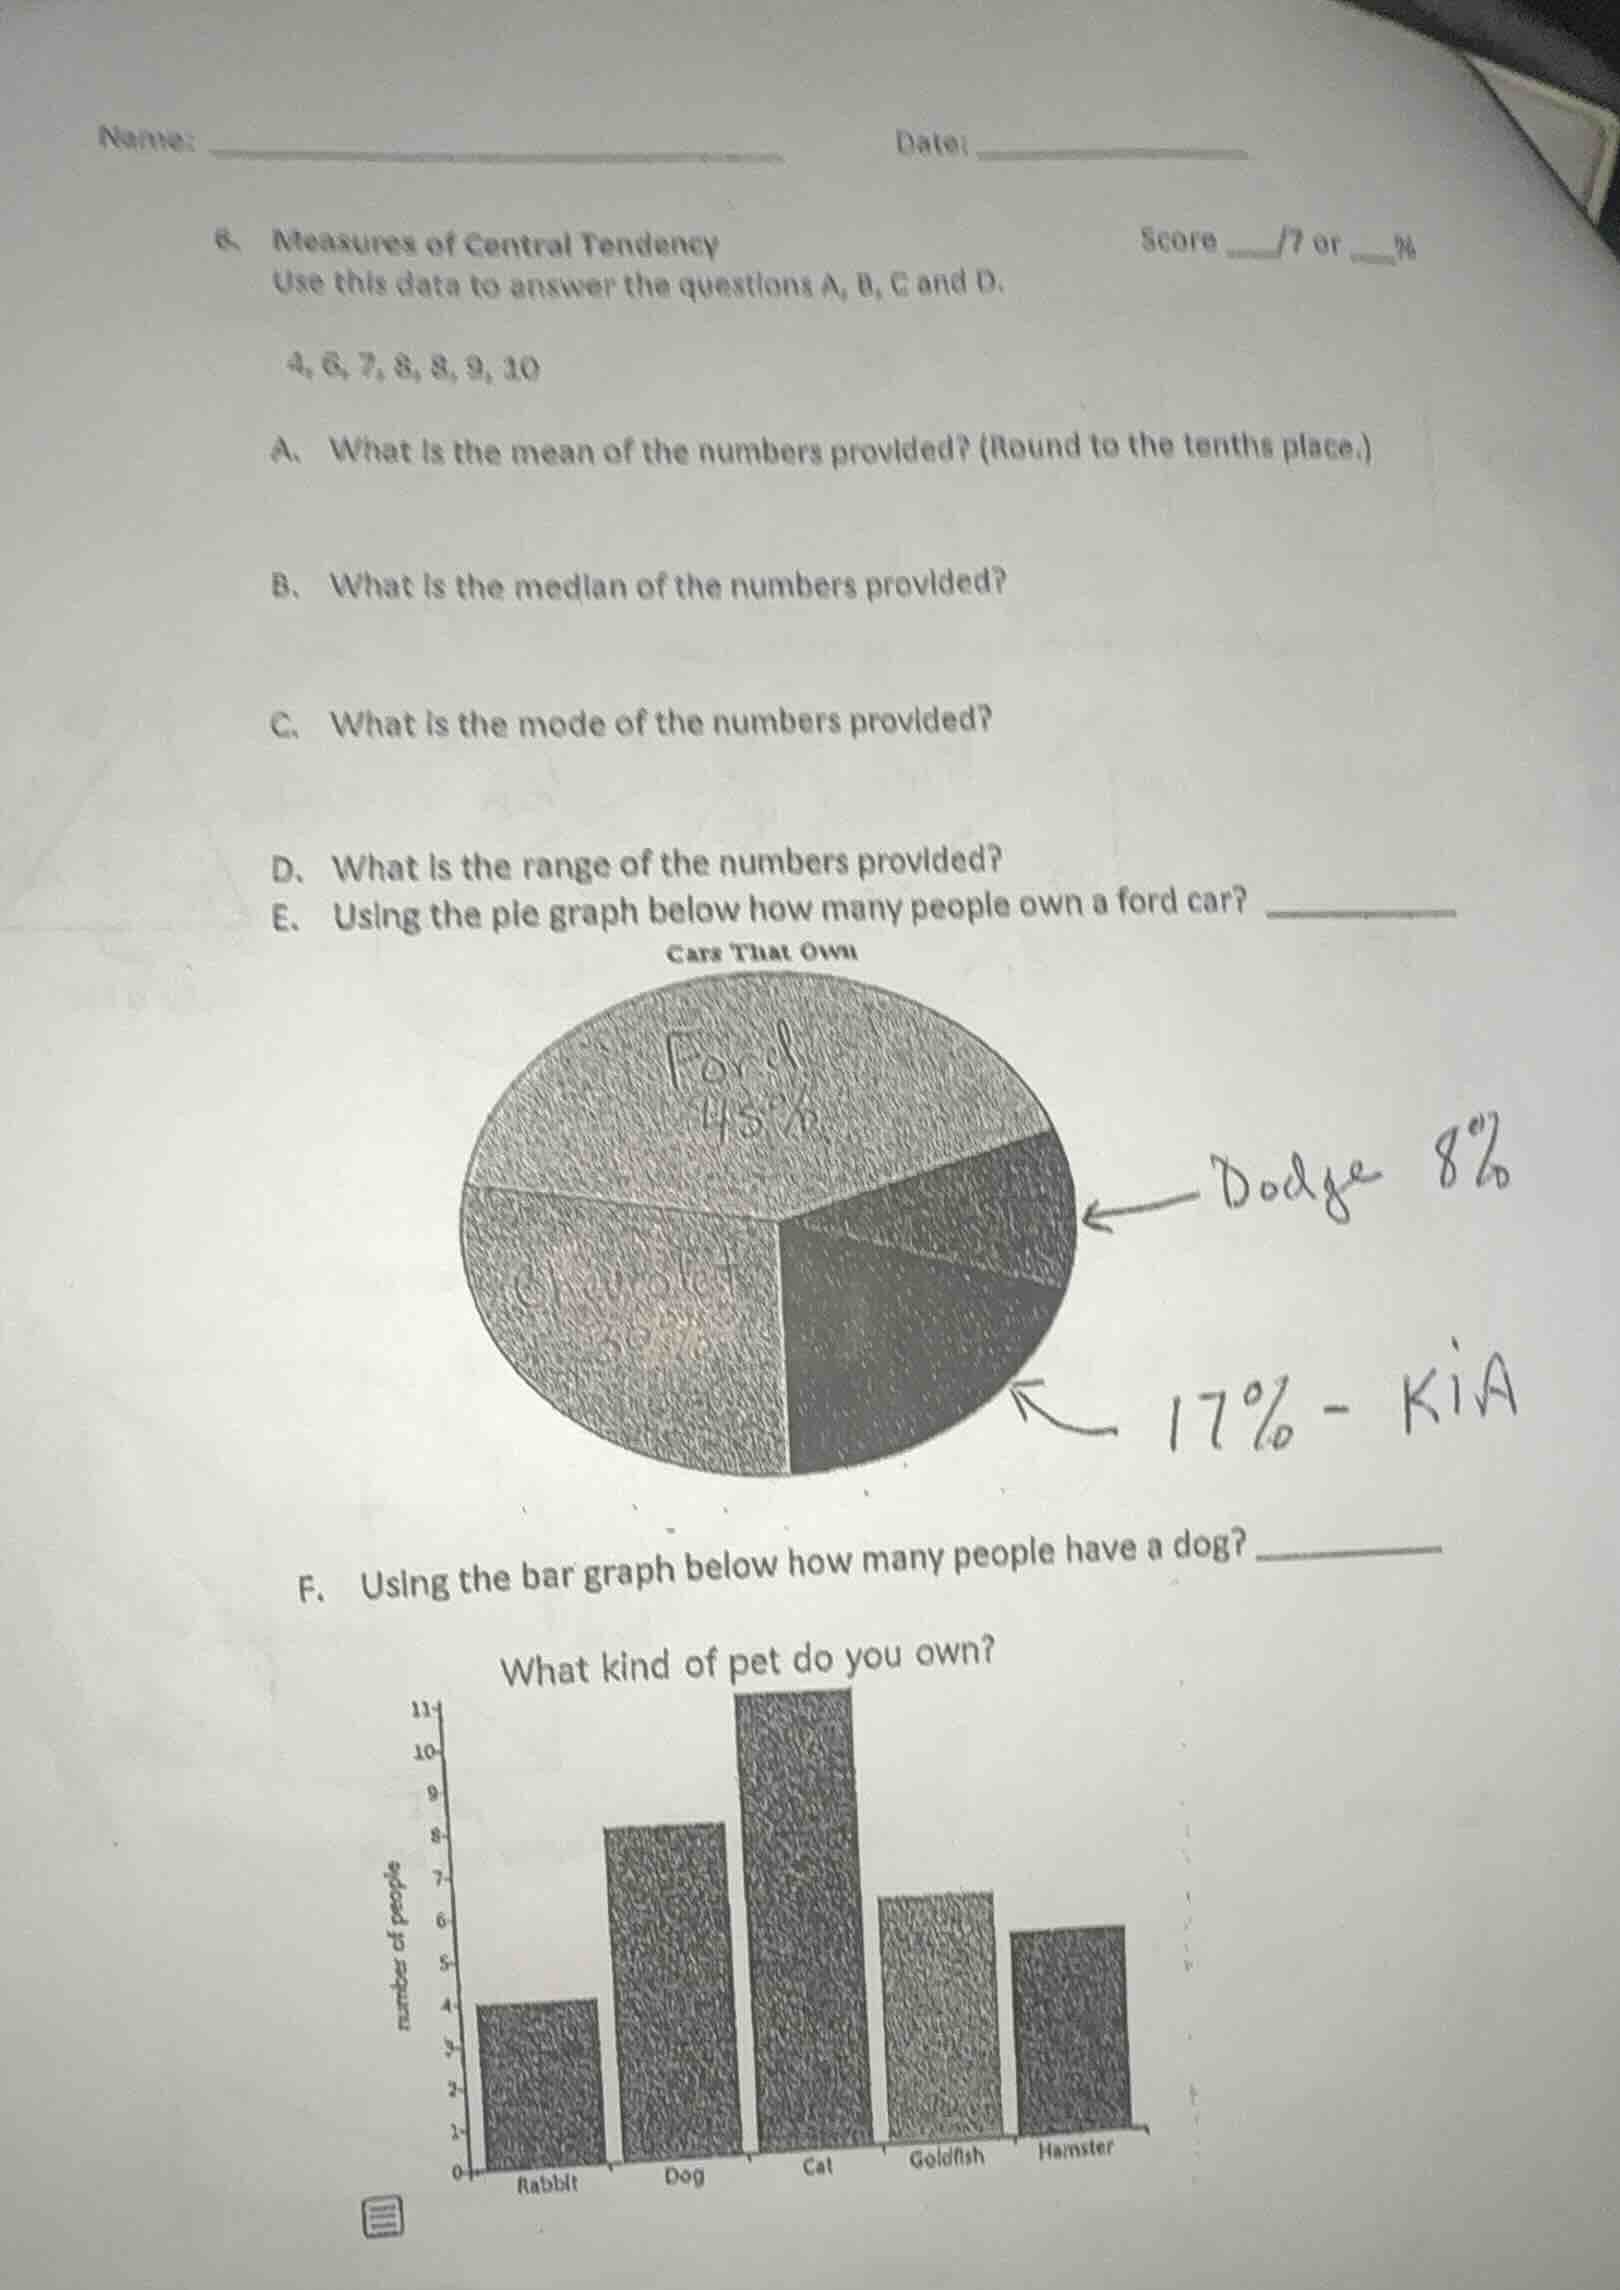
e. using the pie graph below how many people own a ford car? ________
cars that own
f. using the bar graph below how many people have a dog? ________
what kind of pet do you own?
(bar graph with categories rabbit, dog, cat, goldfish, hamster and corresponding number of people)
Step1: Calculate sum of data
$4 + 6 + 7 + 8 + 8 + 9 + 10 = 52$
Step2: Compute mean (A)
$\text{Mean} = \frac{52}{7} \approx 7.4$
Step3: Find median (B)
Data is ordered; middle term is 4th value: $8$
Step4: Identify mode (C)
Most frequent value: $8$
Step5: Calculate range (D)
$\text{Range} = 10 - 4 = 6$
Step6: Note missing total for pie graph (E)
No total population given, cannot compute exact number.
Step7: Read bar graph for dogs (F)
Bar for "Dog" aligns with 8 on y-axis.

Snap & solve any problem in the app
Get step-by-step solutions on Sovi AI
Photo-based solutions with guided steps
Explore more problems and detailed explanations
A. 7.4
B. 8
C. 8
D. 6
E. Cannot be determined (total number of people is not provided)
F. 8