QUESTION IMAGE
Question
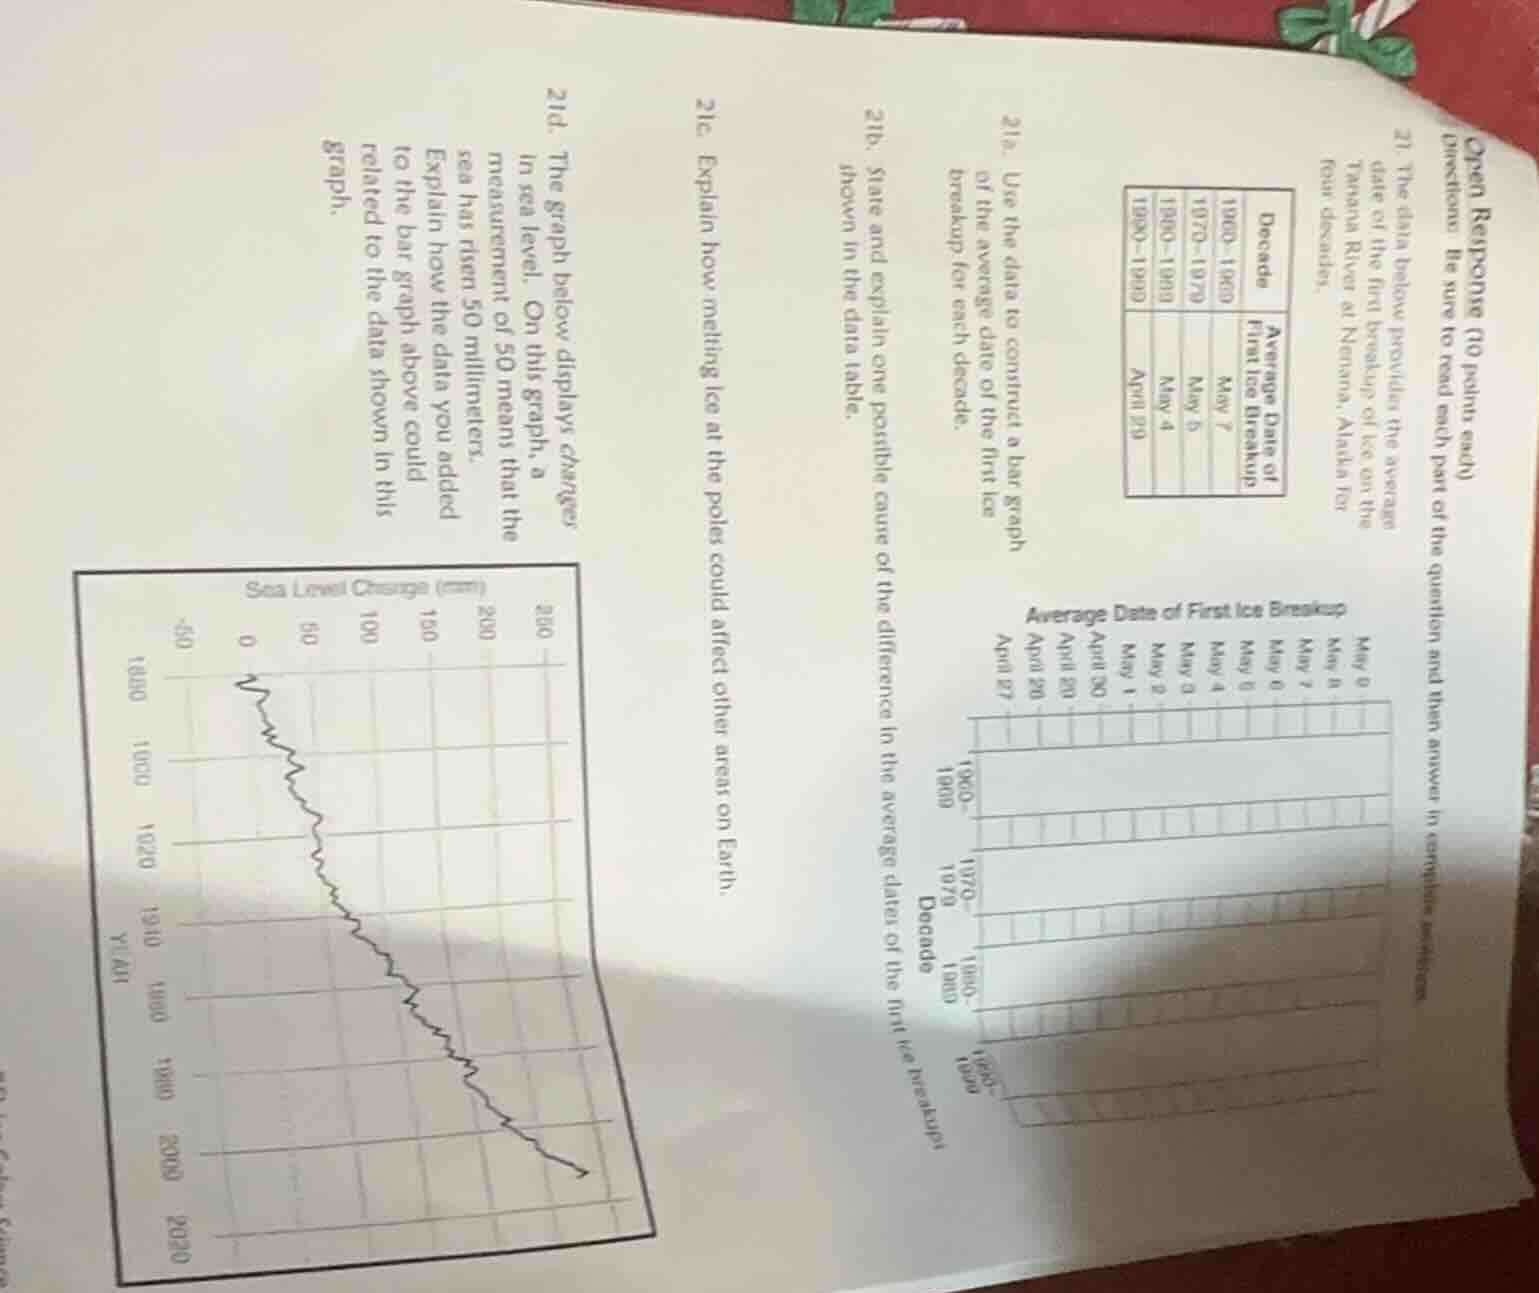
open response (10 points each)
directions: be sure to read each part of the question and then answer in complete sentences.
- the data below provides the average date of the first breakup of ice on the tanana river at nenana, alaska for four decades.
21a. use the data to construct a bar graph of the average date of the first ice breakup for each decade.
21b. state and explain one possible cause of the difference in the average date of the first ice breakup shown in the data table.
21c. explain how melting ice at the poles could affect other areas on earth.
21d. the graph below displays changes in sea level. on this graph, a measurement of 50 means that the sea has risen 50 millimeters. explain how the data you added to the bar graph above could be related to the data shown in this graph.
(table for 21a:
decades | average date of first ice breakup
1960–1969 | may 7
1970–1979 | may 5
1980–1989 | may 4
1990–1999 | april 29
bar graph for 21a is partially drawn with dates from april 27 to may 9 and decades 1960–1969, 1970–1979, 1980–1989, 1990–1999
graph for 21d: sea level change (mm) with years from 1900 to 2020 and a line graph showing sea level change)
21a.
Step1: Identify axes and data
X-axis: Decades; Y-axis: Ice Breakup Dates
Step2: Plot each decade's data
- 1960-1969: Bar aligned to May 7
- 1970-1979: Bar aligned to May 5
- 1980-1989: Bar aligned to May 4
- 1990-1999: Bar aligned to April 29
One possible cause is rising global temperatures from climate change. As atmospheric temperatures increase over time, ice melts earlier, shifting the average breakup date to an earlier point in the spring.
Melting polar ice adds more freshwater to the ocean, which raises global sea levels. Higher sea levels can cause coastal erosion, flooding of low-lying coastal areas and islands, and disrupt coastal ecosystems and human settlements. Additionally, the influx of cold freshwater can alter ocean current patterns, which regulate global climate systems, leading to shifts in regional weather patterns.

Snap & solve any problem in the app
Get step-by-step solutions on Sovi AI
Photo-based solutions with guided steps
Explore more problems and detailed explanations
(Bar graph with four vertical bars, each corresponding to a decade, matched to their respective average ice breakup dates on the y-axis as plotted above)
---