QUESTION IMAGE
Question
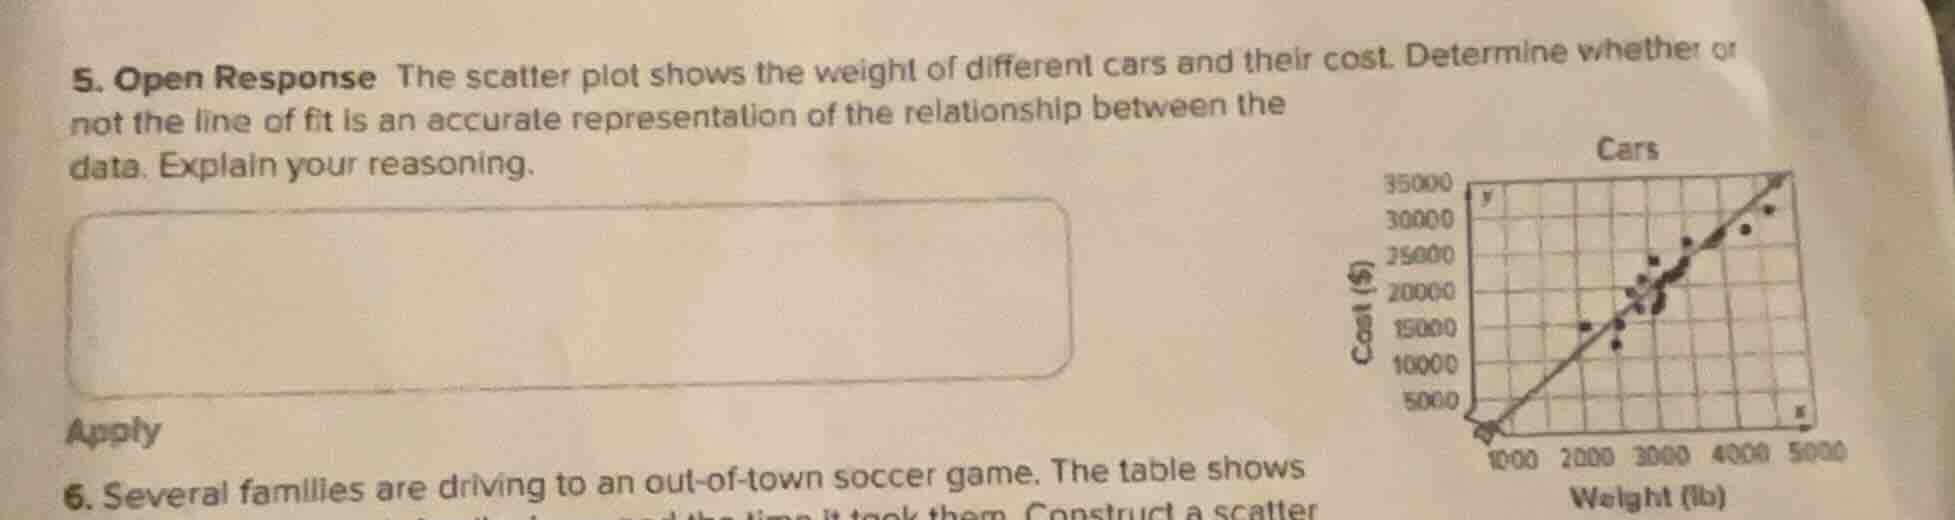
- open response the scatter plot shows the weight of different cars and their cost. determine whether or not the line of fit is an accurate representation of the relationship between the data. explain your reasoning.
apply
- several families are driving to an out - of - town soccer game. the table shows... construct a scatter
Brief Explanations
The line of fit follows the general upward trend of the data points, where as car weight increases, cost tends to increase. Most points are clustered closely around the line, with no large, consistent deviation of points from the line. This means the line aligns well with the overall pattern of the relationship between car weight and cost.

Snap & solve any problem in the app
Get step-by-step solutions on Sovi AI
Photo-based solutions with guided steps
Explore more problems and detailed explanations
Yes, the line of fit is an accurate representation. It closely follows the positive linear trend of the data, with most data points clustered near the line, reflecting the general relationship that heavier cars tend to have a higher cost.