QUESTION IMAGE
Question
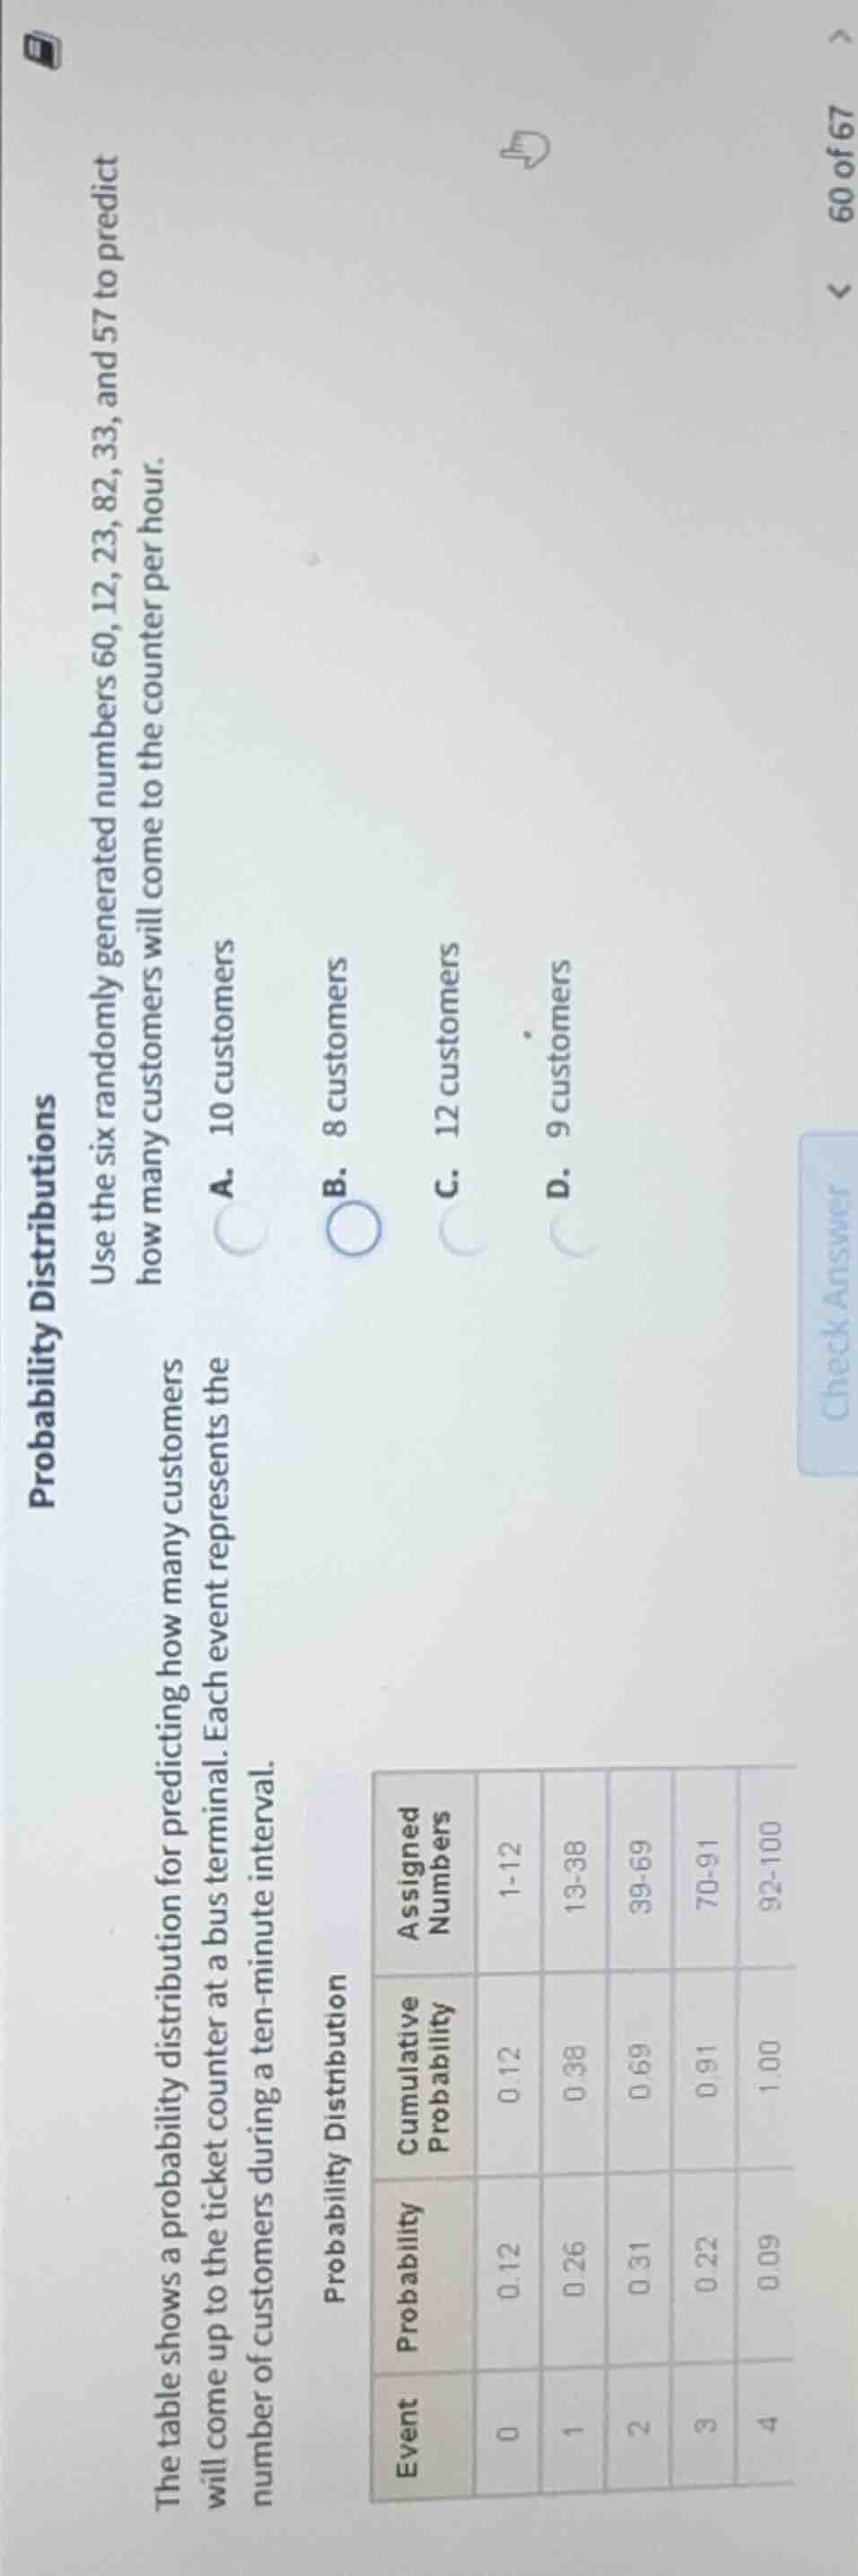
probability distributions
the table shows a probability distribution for predicting how many customers will come up to the ticket counter at a bus terminal during a ten - minute interval.
use the six randomly generated numbers 60, 12, 23, 82, 33, and 57 to predict how many customers will come to the counter per hour.
a. 10 customers
b. 8 customers
c. 12 customers
d. 9 customers
probability distribution
| event | probability | cumulative probability | assigned numbers |
|---|---|---|---|
| 1 | 0.26 | 0.38 | 13 - 38 |
| 2 | 0.31 | 0.69 | 39 - 69 |
| 3 | 0.22 | 0.91 | 70 - 91 |
| 4 | 0.09 | 1.00 | 92 - 100 |
Step1: Map numbers to events
- 60 → Event 2 (39-69)
- 12 → Event 0 (1-12)
- 23 → Event 1 (13-38)
- 82 → Event 3 (70-91)
- 33 → Event 1 (13-38)
- 57 → Event 2 (39-69)
Step2: List event customer counts
Event 0 = 0, Event1=1, Event2=2, Event3=3
Step3: Calculate total customers
$0 + 1 + 2 + 3 + 1 + 2 = 9$

Snap & solve any problem in the app
Get step-by-step solutions on Sovi AI
Photo-based solutions with guided steps
Explore more problems and detailed explanations
D. 9 customers