QUESTION IMAGE
Question
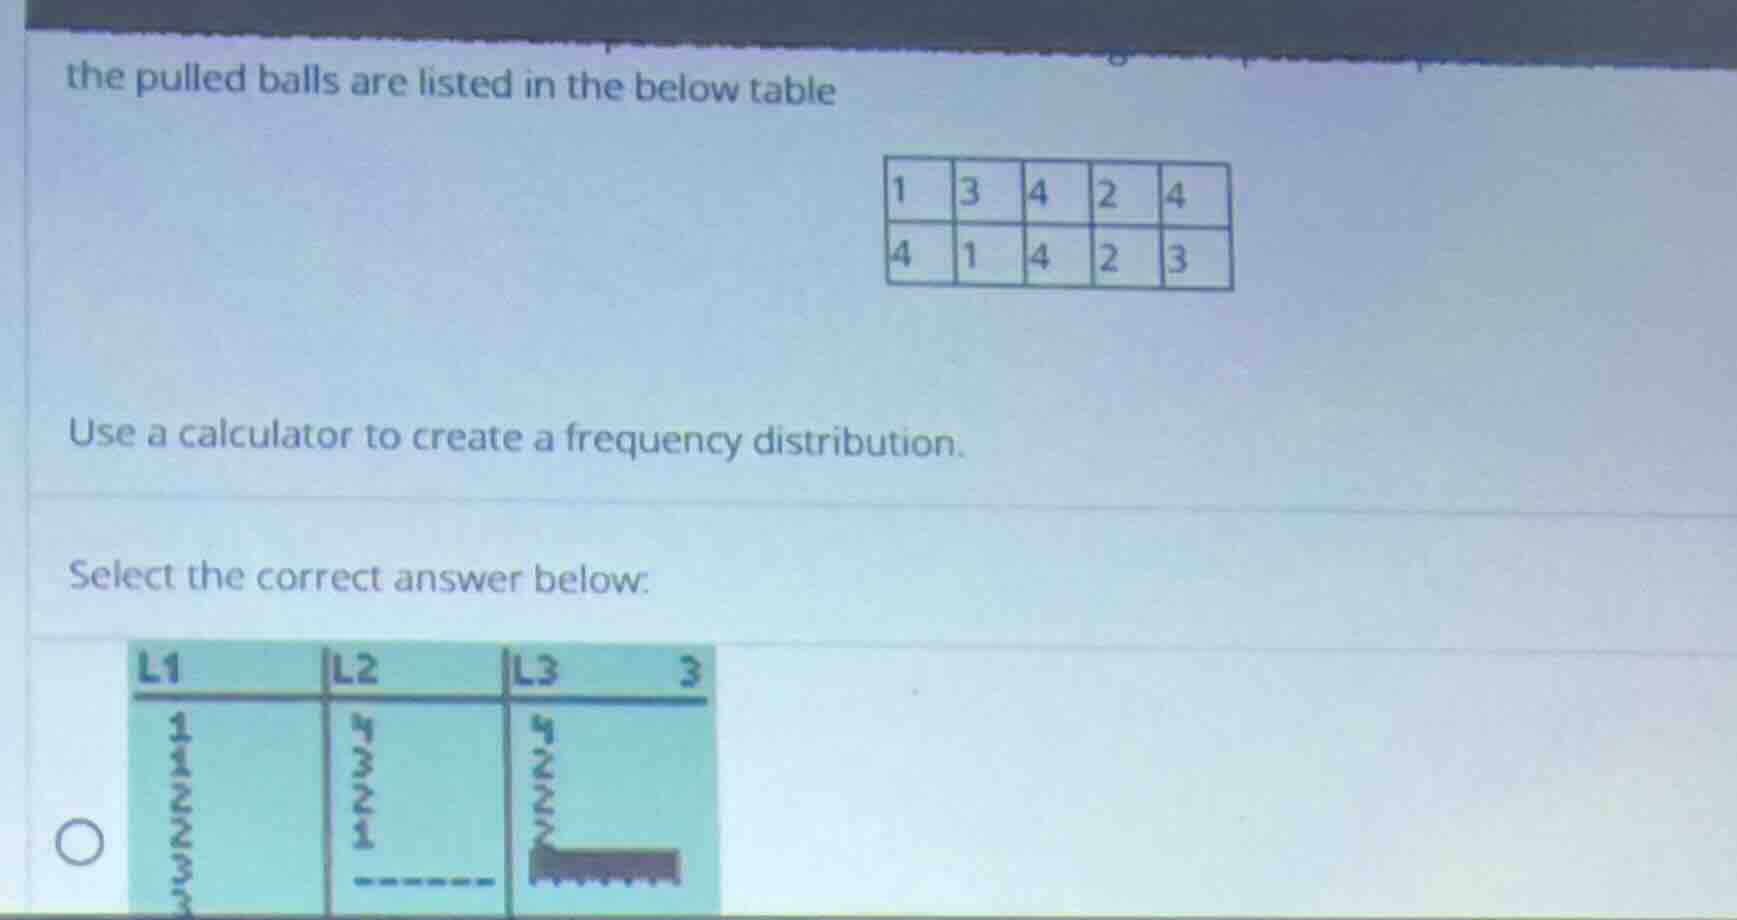
the pulled balls are listed in the below table
1 3 4 2 4
4 1 4 2 3
use a calculator to create a frequency distribution.
select the correct answer below:
Step1: Identify the data values
The data set from the table is: \(1, 3, 4, 2, 4, 4, 1, 4, 2, 3\)
Step2: Count the frequency of each value
- For \(x = 1\): Count how many times 1 appears. From the data, 1 appears 2 times.
- For \(x = 2\): Count how many times 2 appears. 2 appears 2 times.
- For \(x = 3\): Count how many times 3 appears. 3 appears 2 times.
- For \(x = 4\): Count how many times 4 appears. 4 appears 4 times.
Step3: Create the frequency distribution table
| Value (\(x\)) | Frequency (\(f\)) |
|---|---|
| 2 | 2 |
| 3 | 2 |
| 4 | 4 |

Snap & solve any problem in the app
Get step-by-step solutions on Sovi AI
Photo-based solutions with guided steps
Explore more problems and detailed explanations
The frequency distribution table is as follows:
| Value (\(x\)) | Frequency (\(f\)) |
|---|---|
| 2 | 2 |
| 3 | 2 |
| 4 | 4 |