QUESTION IMAGE
Question
quantitative reasoning instruction
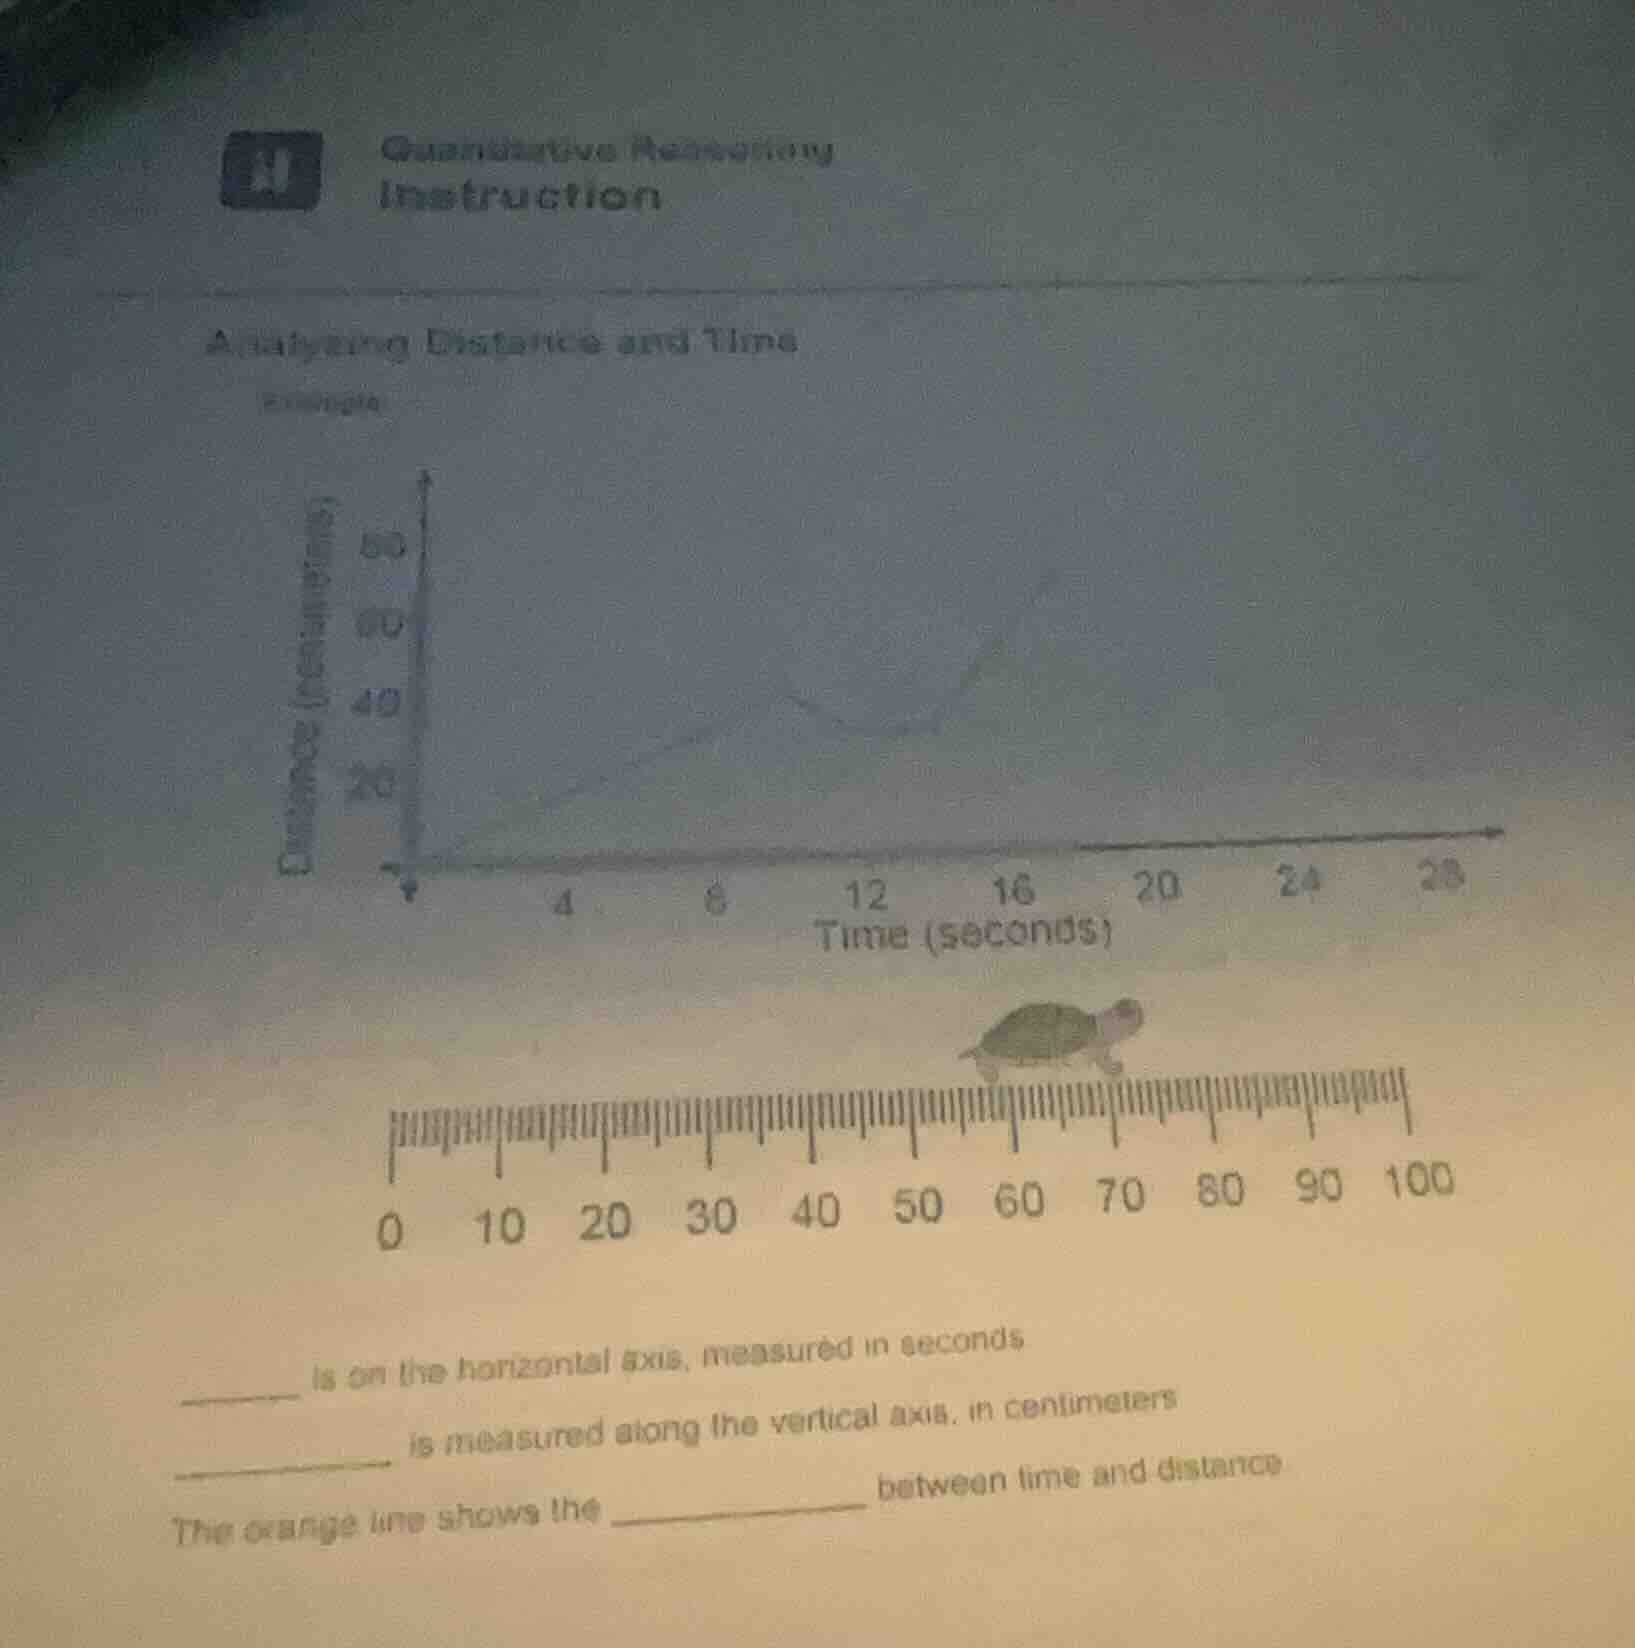
analyzing distance and time
example
______ is on the horizontal axis, measured in seconds
__________ is measured along the vertical axis, in centimeters
the orange line shows the ____________ between time and distance
Brief Explanations
- For the first blank, looking at the graph, the horizontal axis is labeled "Time (seconds)", so the variable on the horizontal axis is Time.
- The vertical axis is labeled "Distance (centimeters)", so the variable measured along the vertical axis is Distance.
- The orange line in a distance - time graph represents the relationship (specifically, it can be a function or a relation) between time and distance. In the context of a distance - time graph, it shows how distance changes with respect to time, so the term "relationship" (or "connection", "correlation") fits here.

Snap & solve any problem in the app
Get step-by-step solutions on Sovi AI
Photo-based solutions with guided steps
Explore more problems and detailed explanations
- The first blank: Time
- The second blank: Distance
- The third blank: relationship