QUESTION IMAGE
Question
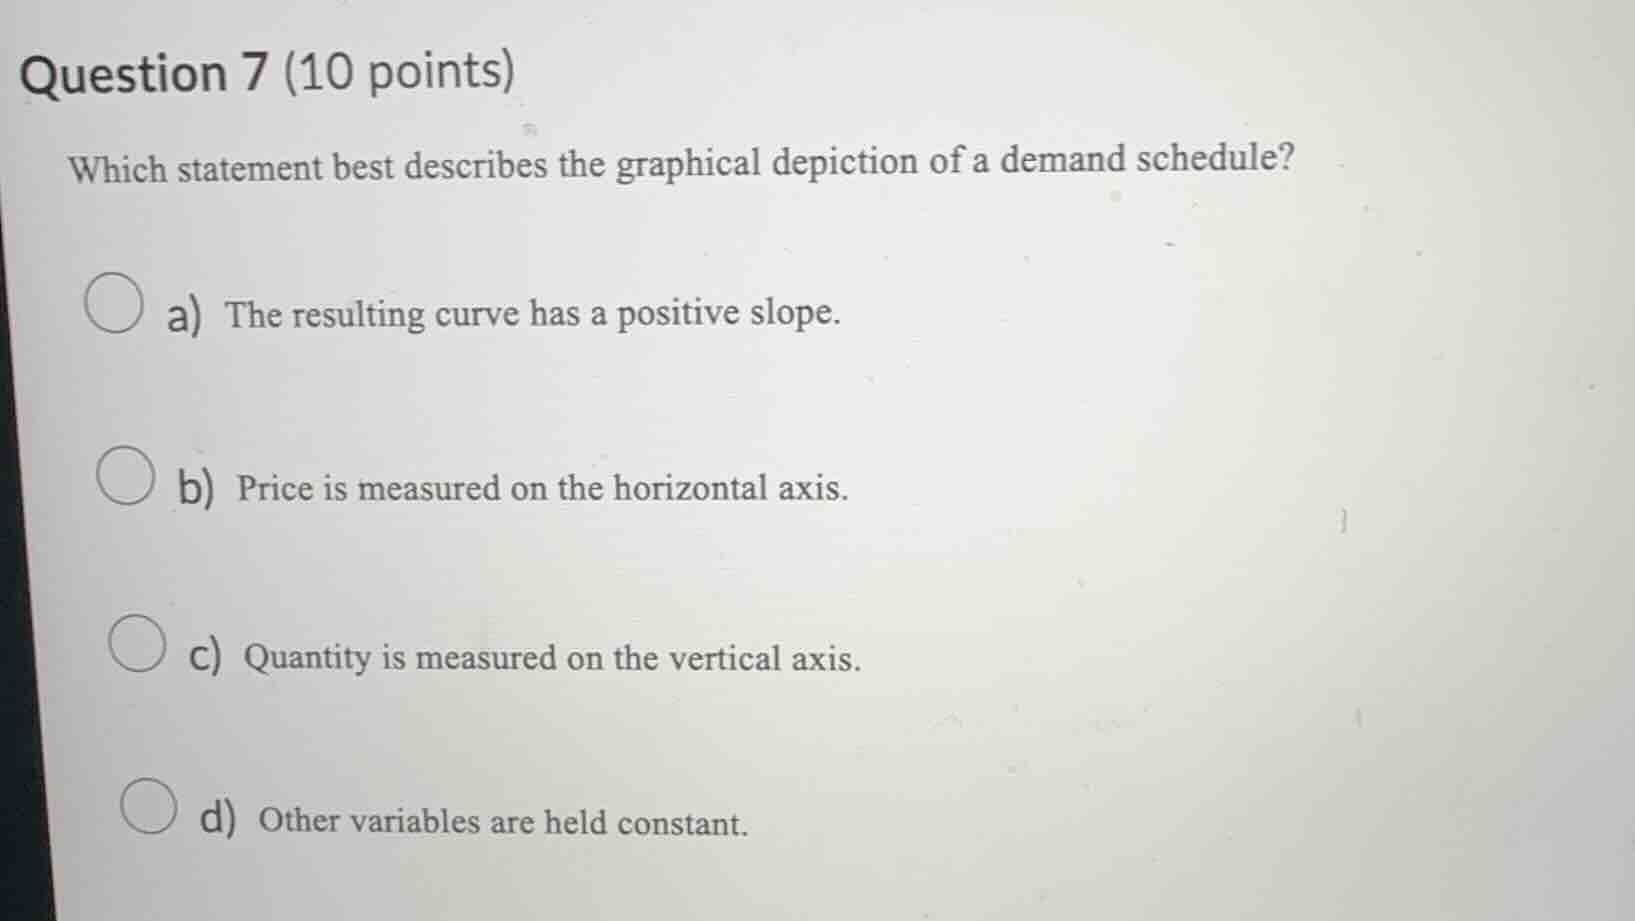
question 7 (10 points)
which statement best describes the graphical depiction of a demand schedule?
a) the resulting curve has a positive slope.
b) price is measured on the horizontal axis.
c) quantity is measured on the vertical axis.
d) other variables are held constant.
A demand curve (graph of demand schedule) follows the ceteris paribus principle, meaning all non-price factors affecting demand are held constant. A demand curve has a negative slope, price is on the vertical axis, and quantity demanded is on the horizontal axis, so options a, b, c are incorrect.

Snap & solve any problem in the app
Get step-by-step solutions on Sovi AI
Photo-based solutions with guided steps
Explore more problems and detailed explanations
d) Other variables are held constant.