QUESTION IMAGE
Question
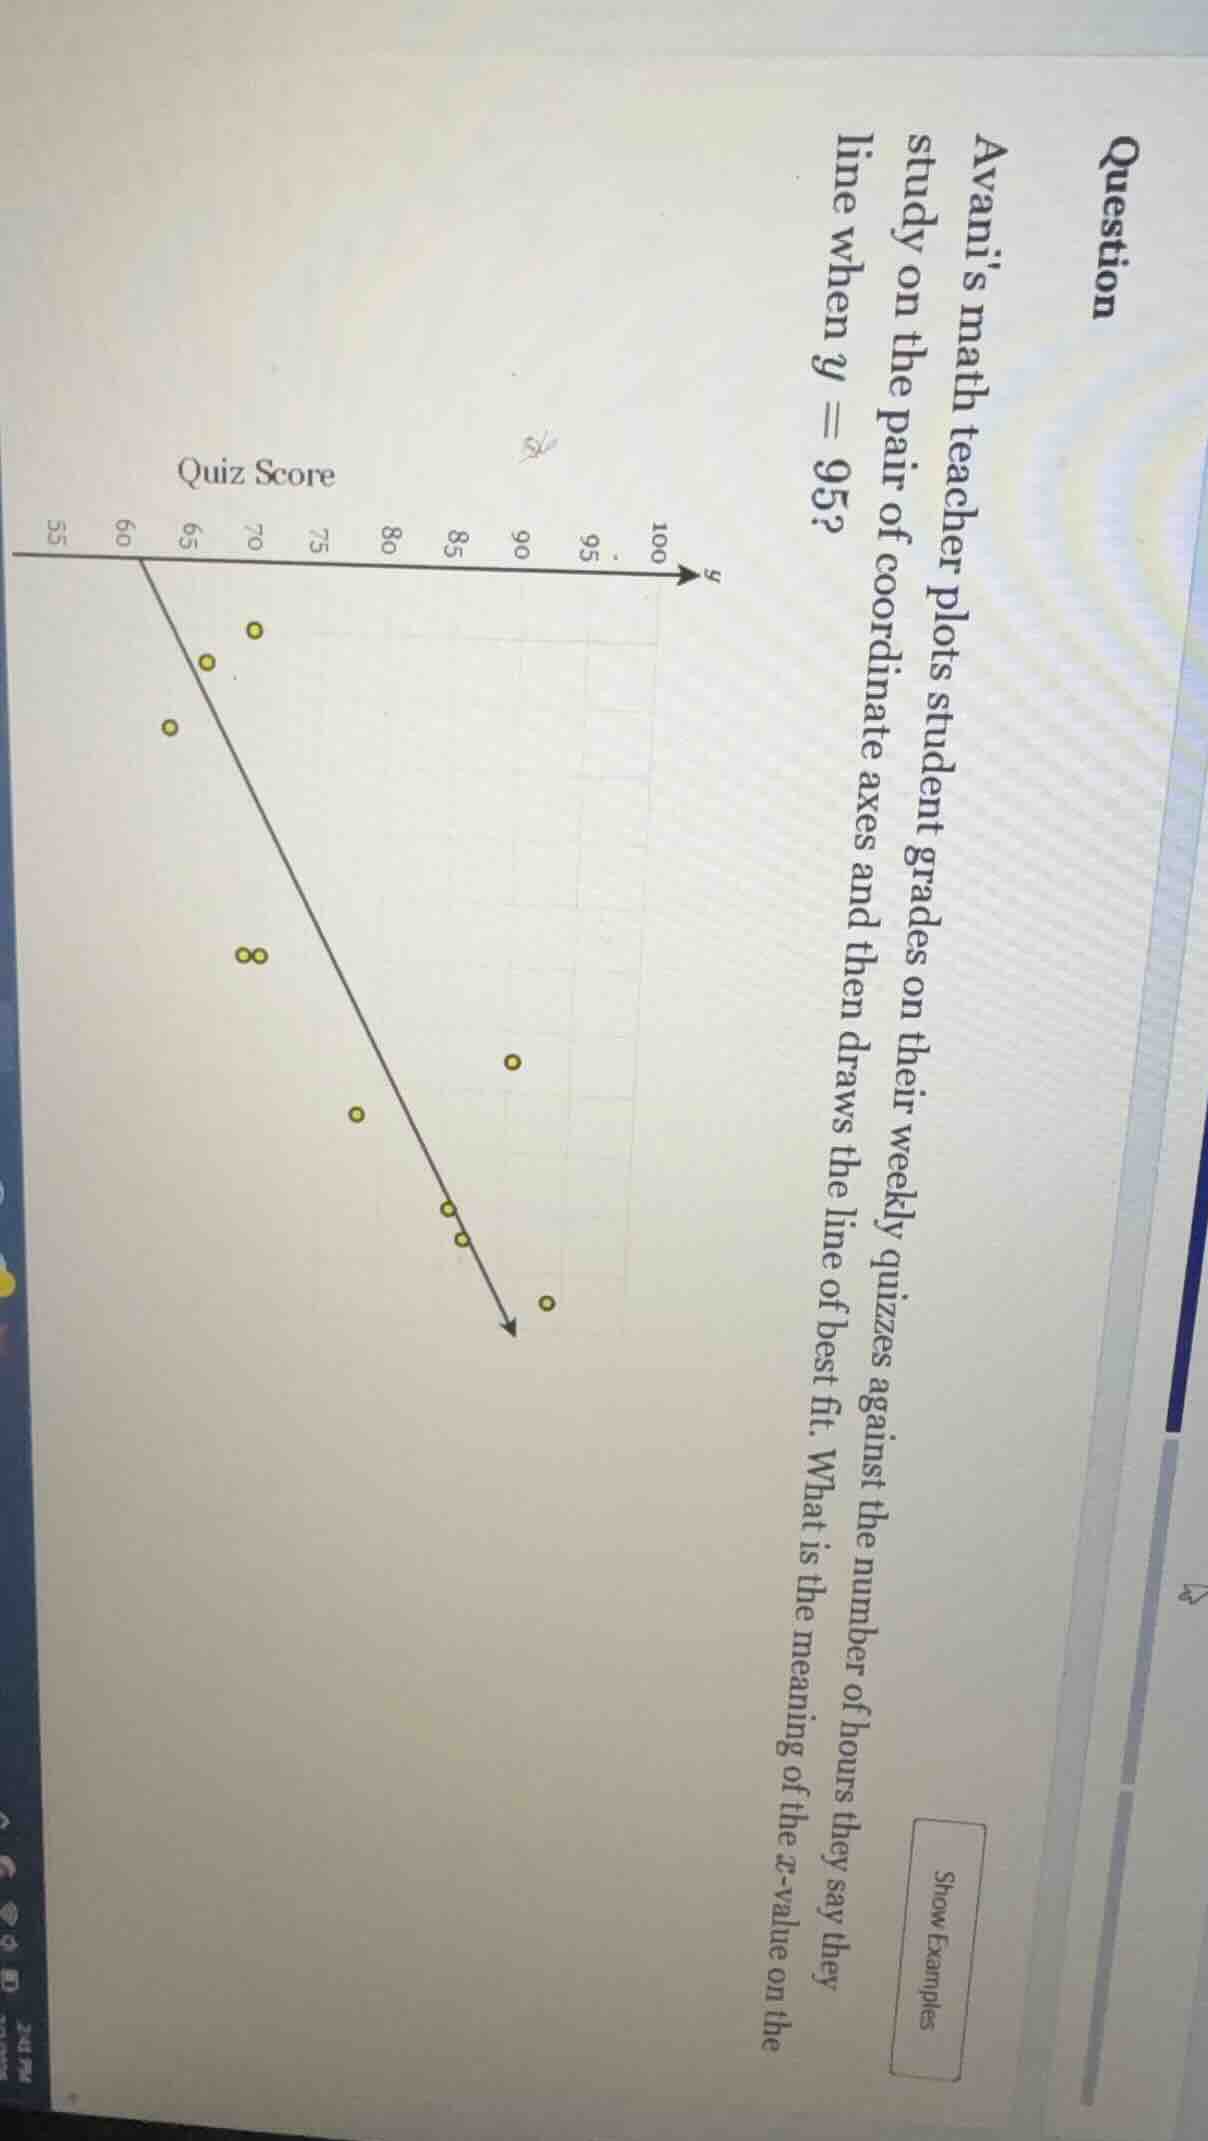
question avanis math teacher plots student grades on their weekly quizzes against the number of hours they say they study on the pair of coordinate axes and then draws the line of best fit. what is the meaning of the x - value on the line when y = 95? quiz score
Step1: Understand the Context
The problem involves a scatter plot with a line of best fit, where the y - axis represents quiz scores and the x - axis represents the number of hours studied. We need to find the meaning of the x - value when \(y = 95\) (quiz score is 95) on the line of best fit.
Step2: Interpret the Line of Best Fit
The line of best fit is a model that shows the relationship between the number of hours studied (x) and the quiz score (y). When we look at a specific y - value (in this case, \(y=95\)) on the line of best fit, the corresponding x - value represents the predicted number of hours a student would study to achieve a quiz score of 95, according to the linear relationship modeled by the line of best fit.

Snap & solve any problem in the app
Get step-by-step solutions on Sovi AI
Photo-based solutions with guided steps
Explore more problems and detailed explanations
The x - value on the line when \(y = 95\) represents the predicted number of hours a student studies to get a quiz score of 95, based on the linear relationship between study hours and quiz scores shown by the line of best fit.