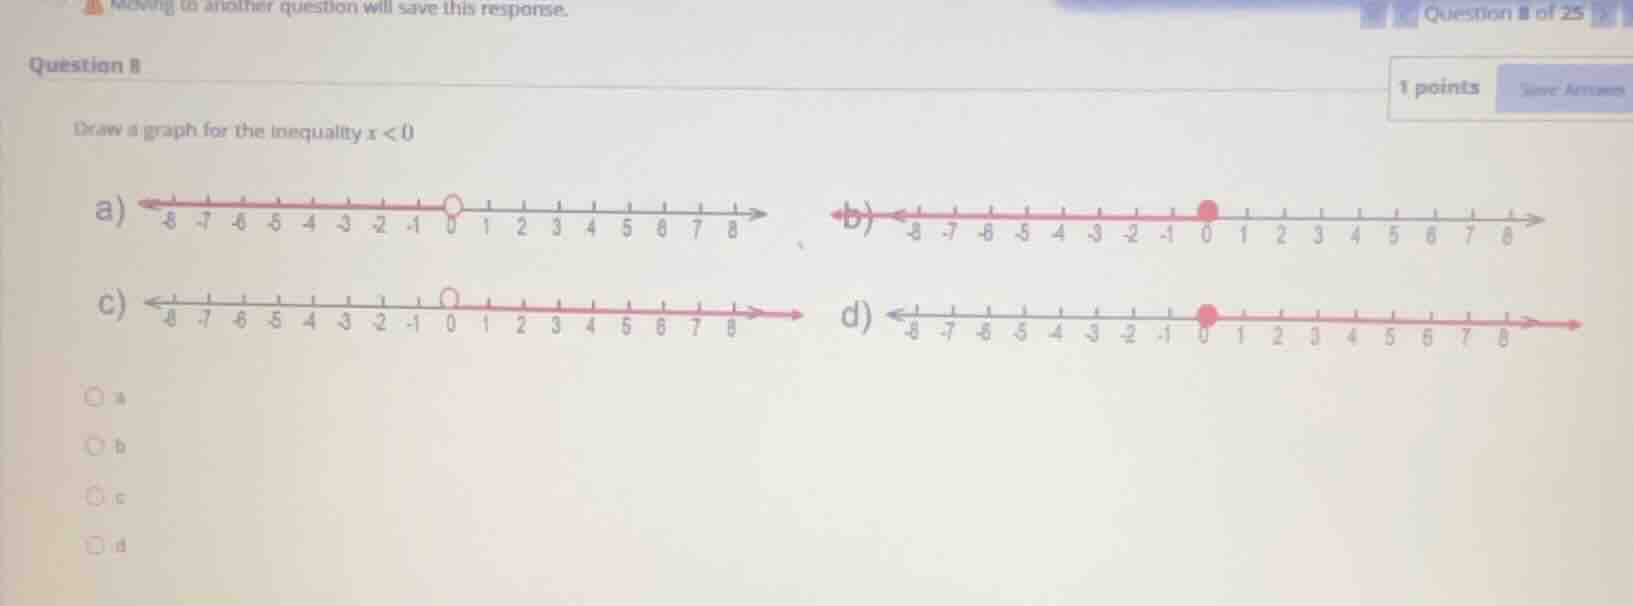
QUESTION IMAGE
Question
question 8
draw a graph for the inequality ( x < 0 )
a) number line with open circle at 0, red to the left
b) number line with closed circle at 0, red to the left
c) number line with open circle at 0, red to the right
d) number line with closed circle at 0, red to the right
options: a, b, c, d
Step1: Analyze inequality symbol
The inequality is $x < 0$, which means $x$ is strictly less than 0. For strict inequalities ($<$ or $>$), we use an open circle at the boundary value (0 here) to show the value is not included.
Step2: Determine shaded region
Since $x$ is less than 0, we shade all values to the left of 0 on the number line, as those are the values smaller than 0.
Step3: Match to options
Option a has an open circle at 0 and shades all values left of 0, which matches the requirements.

Snap & solve any problem in the app
Get step-by-step solutions on Sovi AI
Photo-based solutions with guided steps
Explore more problems and detailed explanations
a) $\overleftarrow{
ule{10em}{0.2pt}} \circ_{0}
ule{10em}{0.2pt}\overrightarrow{}$