QUESTION IMAGE
Question
question 7
m8 mod 5 dynamic review
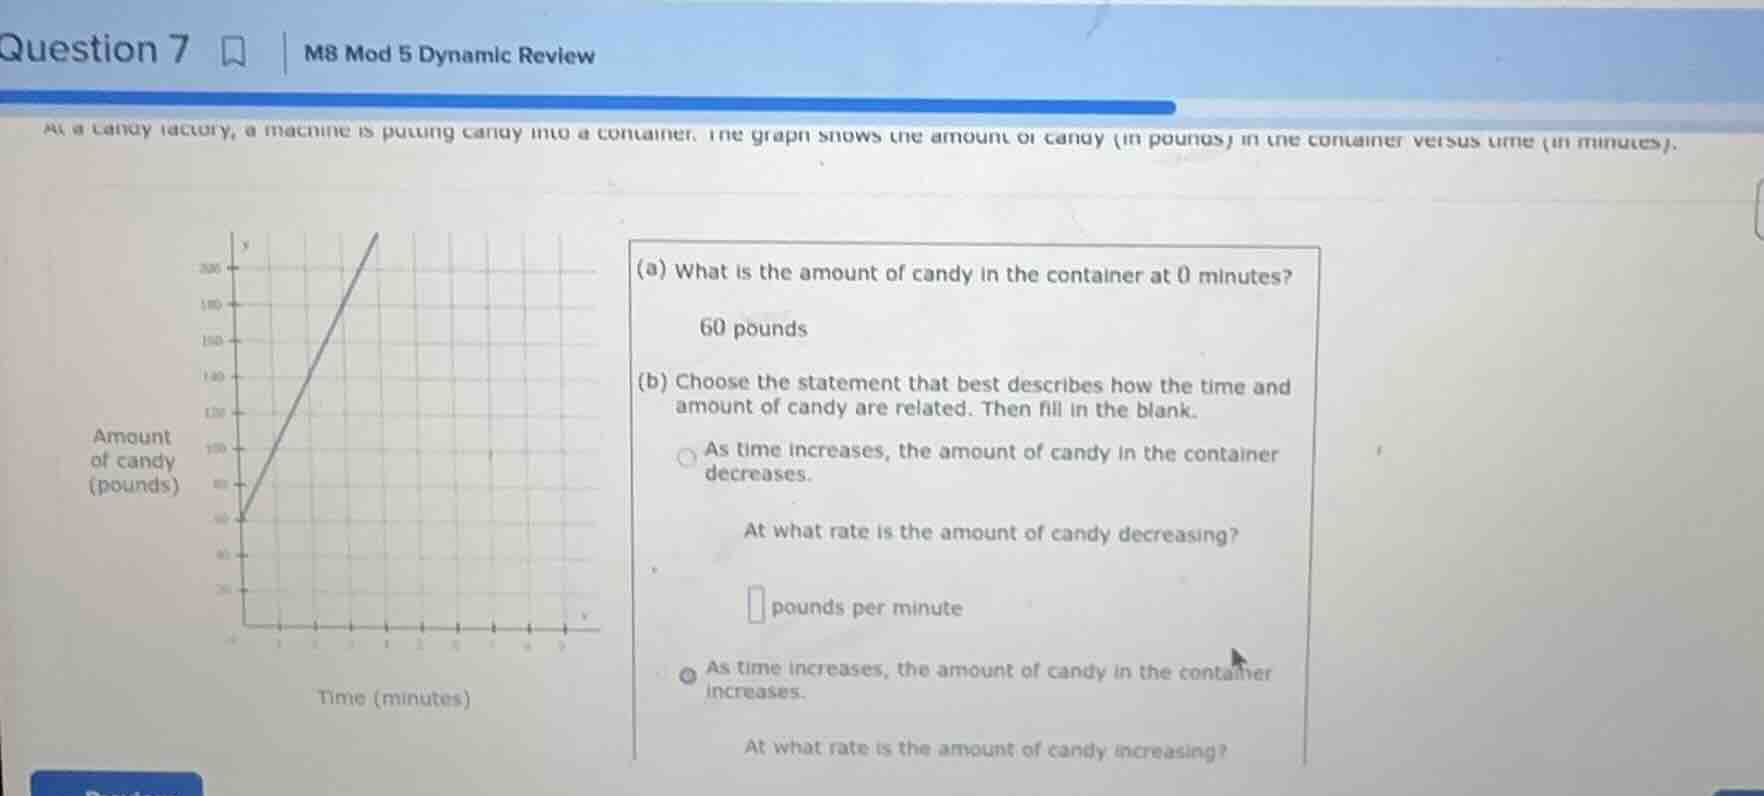
at a candy factory, a machine is putting candy into a container. the graph shows the amount of candy (in pounds) in the container versus time (in minutes).
(a) what is the amount of candy in the container at 0 minutes?
60 pounds
(b) choose the statement that best describes how the time and
amount of candy are related. then fill in the blank.
○ as time increases, the amount of candy in the container
decreases.
at what rate is the amount of candy decreasing?
□ pounds per minute
● as time increases, the amount of candy in the container
increases.
at what rate is the amount of candy increasing?
Step1: Identify initial amount (t=0)
From the graph, when time $t=0$, the amount of candy is the y-intercept, which is 60 pounds.
Step2: Analyze relationship trend
The line on the graph slopes upward, so as time increases, the amount of candy increases.
Step3: Calculate rate of increase
Pick two points: $(0, 60)$ and $(2, 140)$. The rate is the slope:
$\text{Rate} = \frac{\text{Change in amount}}{\text{Change in time}} = \frac{140 - 60}{2 - 0} = \frac{80}{2} = 40$ pounds per minute.

Snap & solve any problem in the app
Get step-by-step solutions on Sovi AI
Photo-based solutions with guided steps
Explore more problems and detailed explanations
(a) 60 pounds
(b) Correct statement: As time increases, the amount of candy in the container increases.
Rate of increase: 40 pounds per minute