QUESTION IMAGE
Question
question
part 2 of 3 completed: 7 of 9 my score: 7/9 pts (77.78%)
save
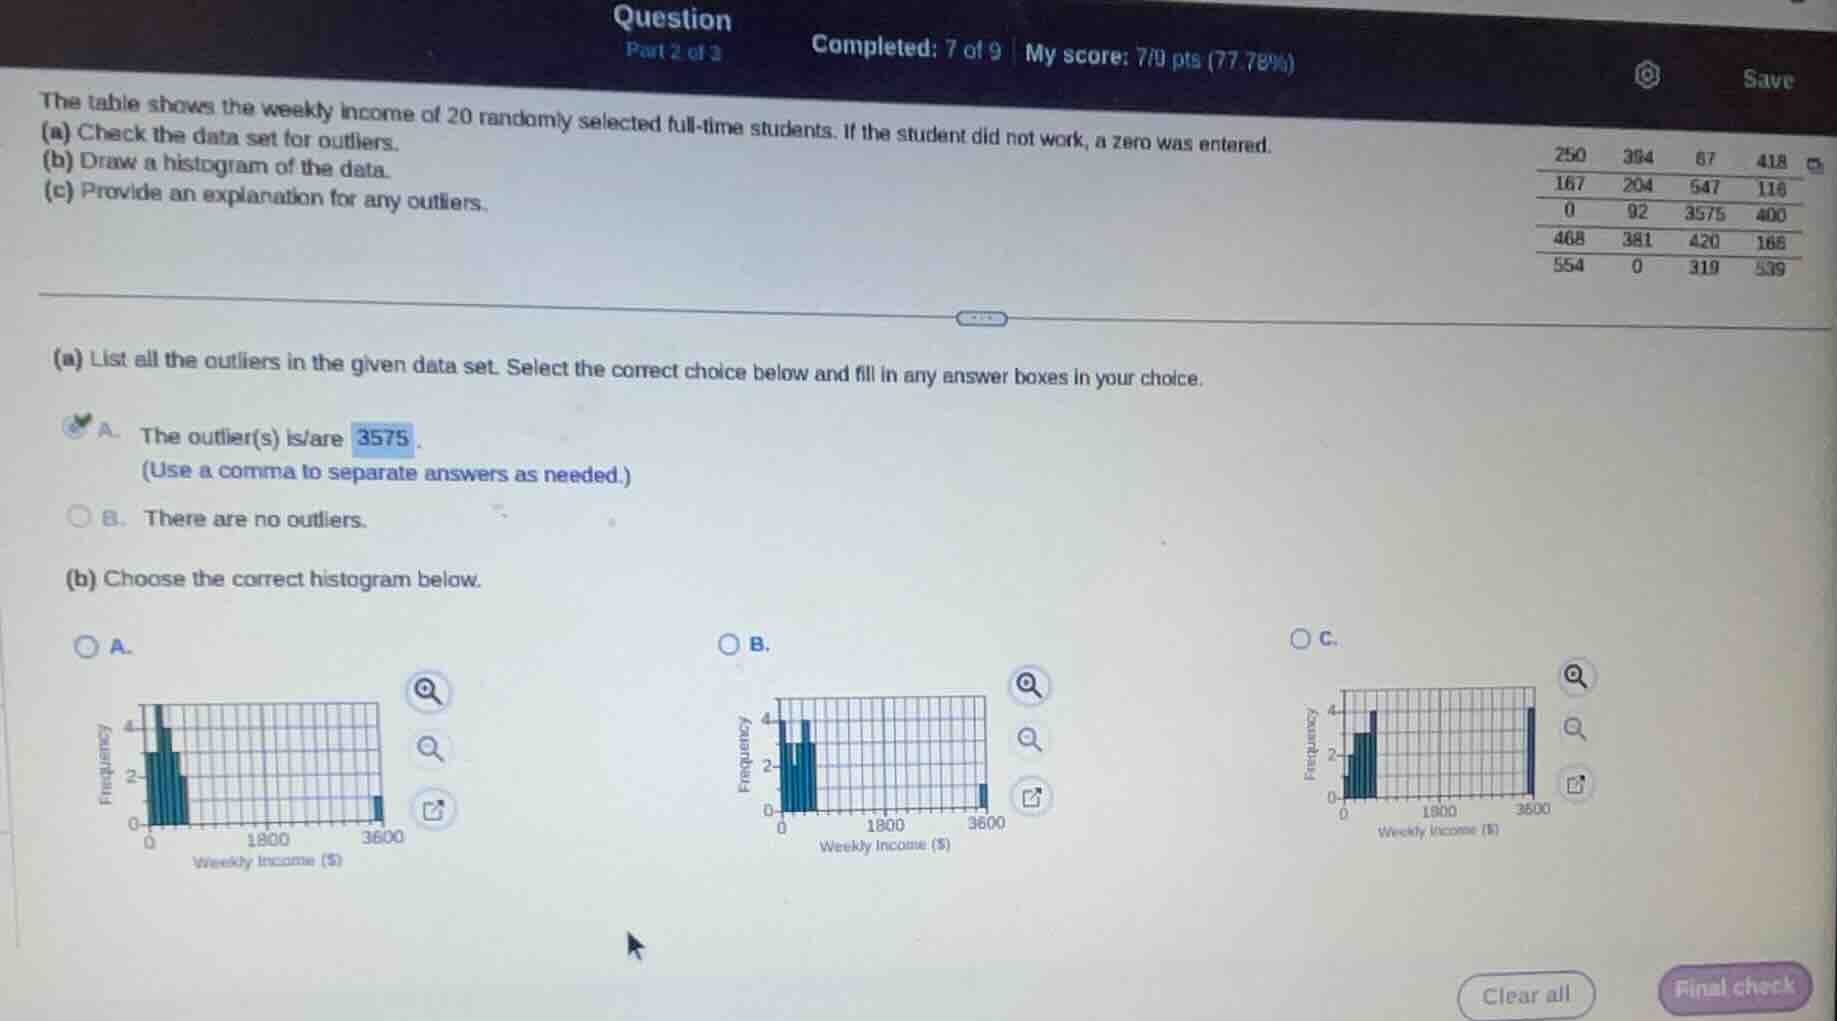
the table shows the weekly income of 20 randomly selected full-time students. if the student did not work, a zero was entered.
(a) check the data set for outliers.
(b) draw a histogram of the data.
(c) provide an explanation for any outliers.
250 394 87 418
167 204 547 118
0 92 3575 400
468 381 420 168
554 0 319 539
(a) list all the outliers in the given data set. select the correct choice below and fill in any answer boxes in your choice.
a. the outlier(s) is/are 3575
(use a comma to separate answers as needed.)
b. there are no outliers.
(b) choose the correct histogram below.
a.
b.
c.
Step1: Confirm outlier
The value 3575 is far larger than all other data points (most values are under 600), so it is the only outlier.
Step2: Match histogram
Most data points cluster between $0 and $600, with a single outlier near $3600. Histogram C has high frequency on the left (low income values) and a single bar on the far right for the outlier, which matches the data.
Step3: Explain outlier
The outlier 3575 is an extremely high weekly income compared to typical student earnings, likely from a unique high-paying role, one-time payment, or data entry anomaly.

Snap & solve any problem in the app
Get step-by-step solutions on Sovi AI
Photo-based solutions with guided steps
Explore more problems and detailed explanations
(a) A. The outlier(s) is/are 3575
(b) C.
(c) The outlier 3575 is an unusually high weekly income that deviates drastically from the typical earnings of full-time students, which are mostly below $600. It may stem from a rare high-paying job, a one-time payment, or a data recording error.