QUESTION IMAGE
Question
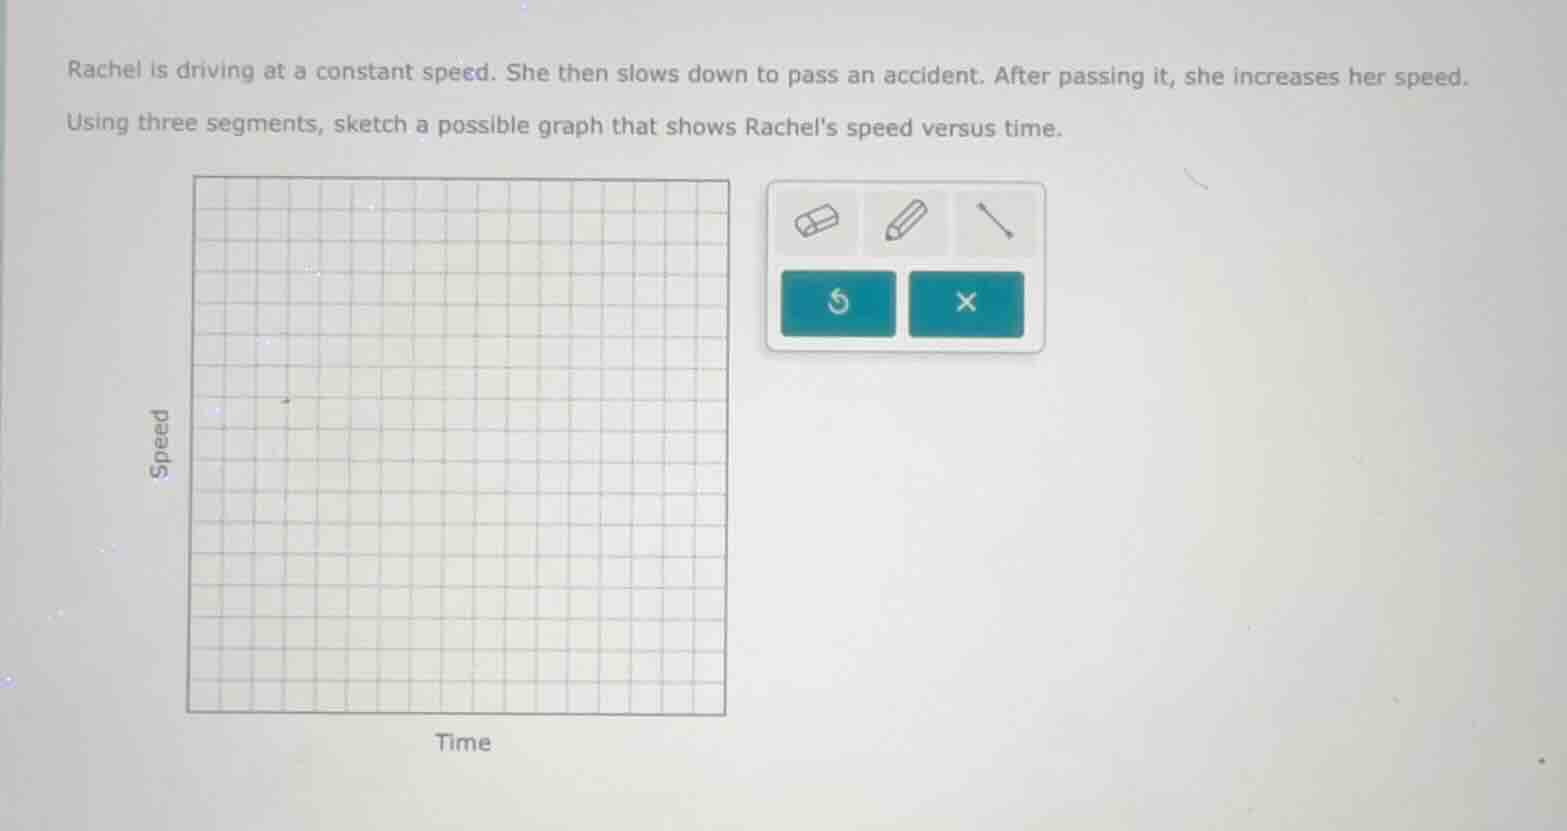
rachel is driving at a constant speed. she then slows down to pass an accident. after passing it, she increases her speed. using three segments, sketch a possible graph that shows rachels speed versus time.
Step1: First Segment (Constant Speed)
Rachel starts driving at a constant speed. On a speed - time graph, a constant speed is represented by a horizontal line segment. Let's assume she starts at time \(t = 0\) and has a speed \(v_1\). So, we draw a horizontal line from the starting point (say, \((0,v_1)\)) for a certain amount of time.
Step2: Second Segment (Slowing Down)
Then she slows down to pass the accident. Slowing down means a decrease in speed over time. So, we draw a line segment with a negative slope (since speed is decreasing as time increases) from the end - point of the first segment.
Step3: Third Segment (Increasing Speed)
After passing the accident, she increases her speed. This is represented by a line segment with a positive slope (since speed is increasing as time increases) starting from the end - point of the second segment. The final speed can be equal to or different from the initial constant speed, but in a simple case, we can make it equal to the initial speed for simplicity.

Snap & solve any problem in the app
Get step-by-step solutions on Sovi AI
Photo-based solutions with guided steps
Explore more problems and detailed explanations
- First segment: Horizontal line (constant speed) from \((0, v)\) (where \(v\) is the initial speed) for some time interval.
- Second segment: Line with negative slope (decreasing speed) from the end of the first segment.
- Third segment: Line with positive slope (increasing speed) from the end of the second segment, ending at a speed equal to (or close to) the initial speed.
(Note: Since this is a sketching problem, the above description gives the steps to draw the graph. If a visual graph was to be drawn, it would have the three segments as described: horizontal, decreasing slope, increasing slope.)