QUESTION IMAGE
Question
read the question below and select the correct answer choice.
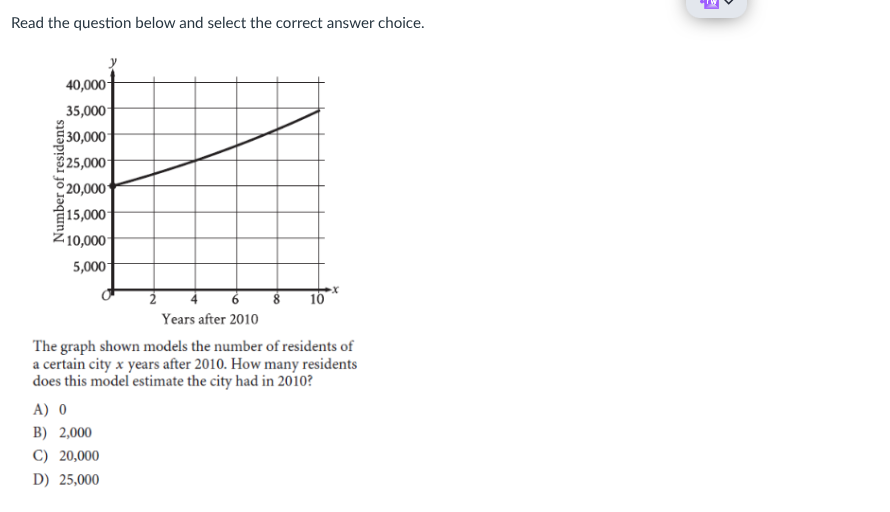
the graph shown models the number of residents of a certain city ( x ) years after 2010. how many residents does this model estimate the city had in 2010?
a) 0
b) 2,000
c) 20,000
d) 25,000
Brief Explanations
To find the number of residents in 2010, we look at the value of \( x = 0 \) (since 2010 is 0 years after 2010) on the graph. The \( y \)-intercept (where \( x = 0 \)) of the line is at \( y = 20,000 \). This means when \( x = 0 \) (in 2010), the number of residents is 20,000.

Snap & solve any problem in the app
Get step-by-step solutions on Sovi AI
Photo-based solutions with guided steps
Explore more problems and detailed explanations
C) 20,000