QUESTION IMAGE
Question
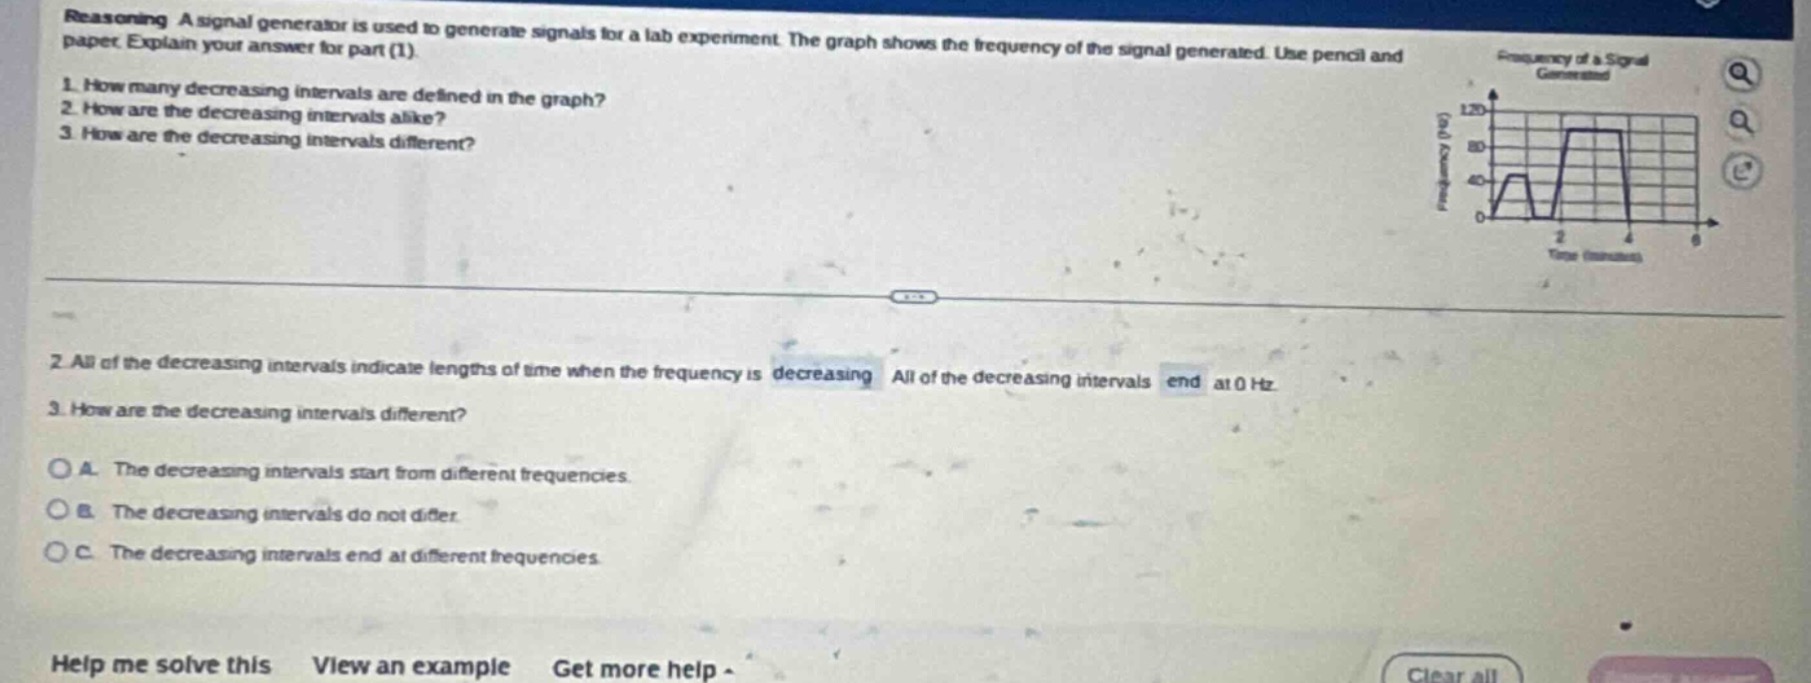
reasoning a signal generator is used to generate signals for a lab experiment. the graph shows the frequency of the signal generated. use pencil and paper. explain your answer for part (1).
- how many decreasing intervals are defined in the graph?
- how are the decreasing intervals alike?
- how are the decreasing intervals different?
- all of the decreasing intervals indicate lengths of time when the frequency is decreasing all of the decreasing intervals end at 0 hz.
- how are the decreasing intervals different?
a. the decreasing intervals start from different frequencies.
b. the decreasing intervals do not differ.
c. the decreasing intervals end at different frequencies.
Question 3 (Multiple Choice)
To determine how the decreasing intervals differ, we analyze the start frequencies. From the graph, one decreasing interval starts at 40 Hz (first peak) and another at 100 Hz (second peak, assuming the middle flat is around 100 Hz). So they start from different frequencies. Option B is wrong as they do differ. Option C is wrong as all end at 0 Hz (from the graph’s decreasing parts ending at 0). Thus, A is correct.

Snap & solve any problem in the app
Get step-by-step solutions on Sovi AI
Photo-based solutions with guided steps
Explore more problems and detailed explanations
A. The decreasing intervals start from different frequencies.