QUESTION IMAGE
Question
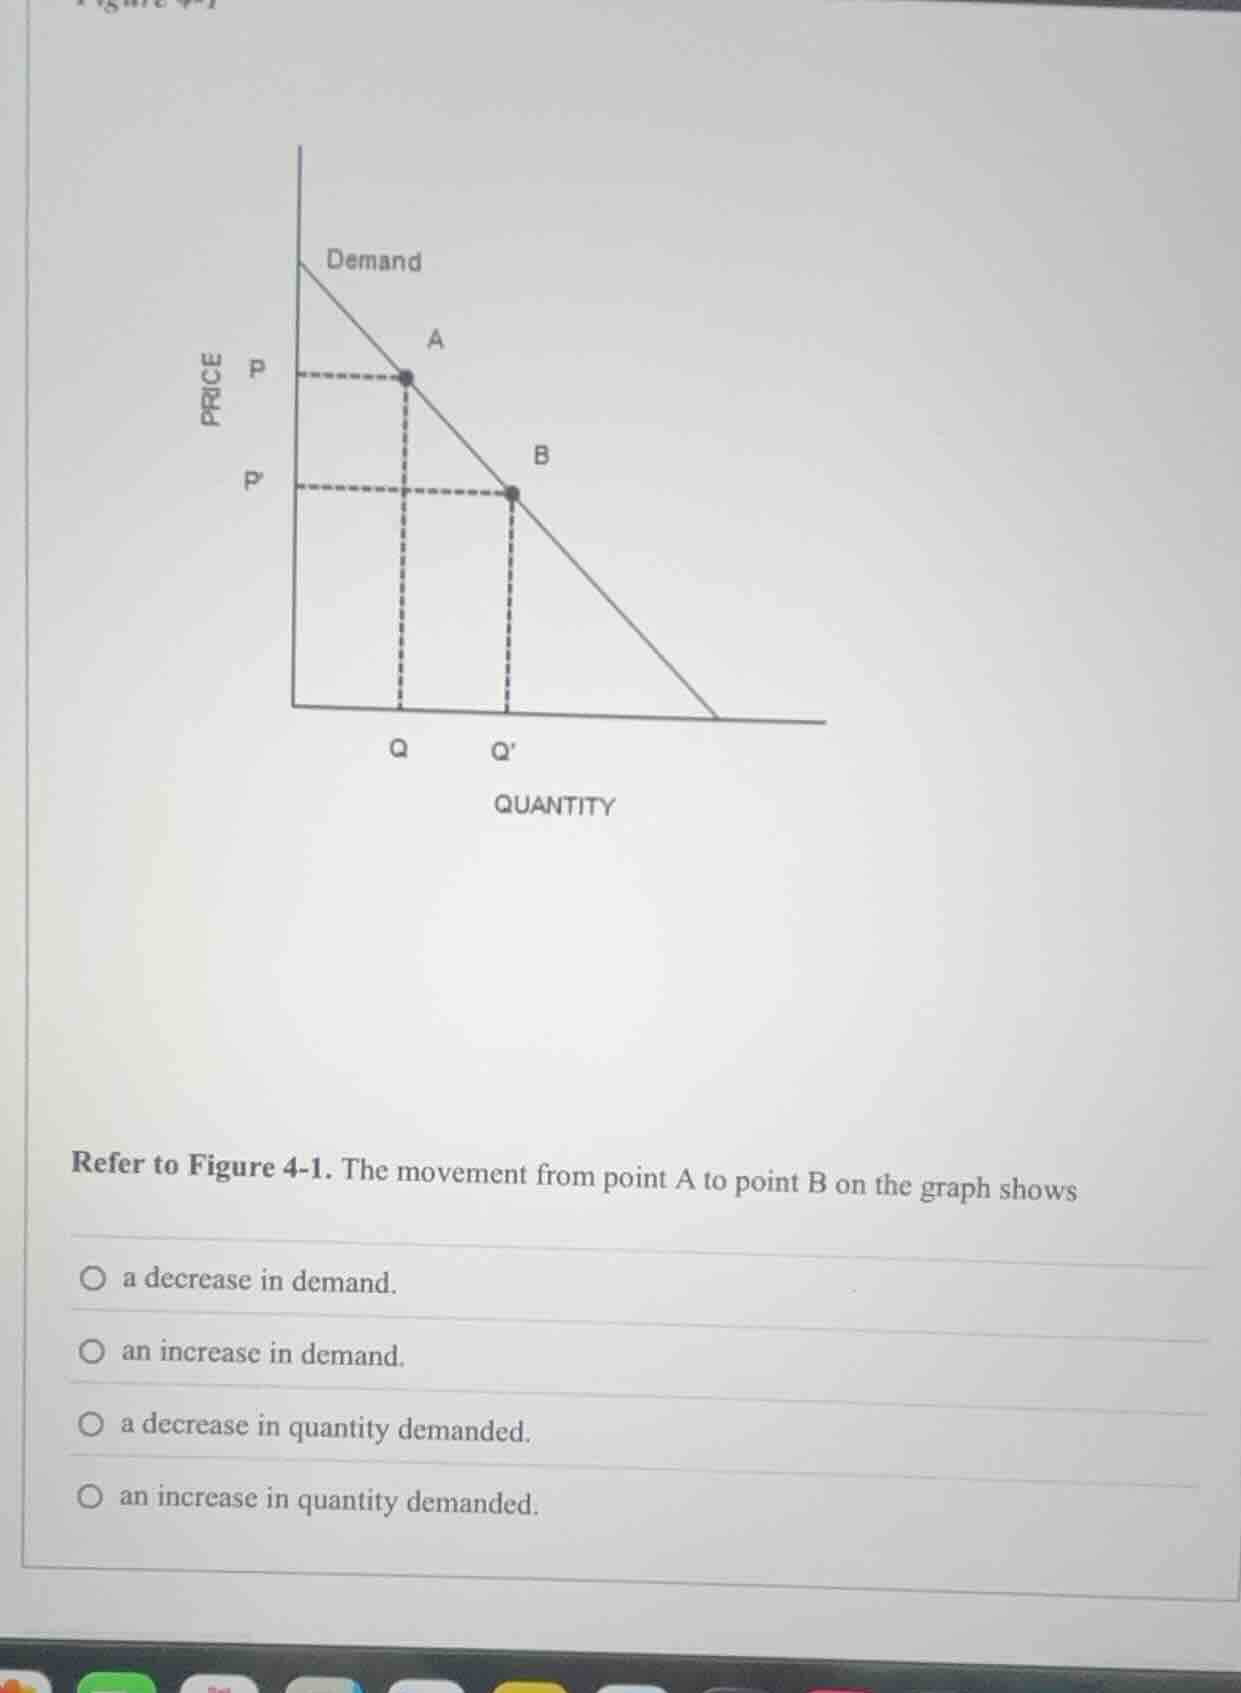
refer to figure 4-1. the movement from point a to point b on the graph shows
a decrease in demand.
an increase in demand.
a decrease in quantity demanded.
an increase in quantity demanded.
Brief Explanations
To determine the correct answer, we analyze the movement along the demand curve. A movement from point A to point B on the demand curve occurs due to a change in price (price decreases from \( P \) to \( p \)). According to the law of demand, when the price of a good decreases, the quantity demanded increases, assuming other factors remain constant.
- A "decrease in demand" or "increase in demand" would involve a shift of the entire demand curve, not a movement along it.
- A "decrease in quantity demanded" would occur if price increased (moving up along the curve), but here price decreases.
- An "increase in quantity demanded" occurs when price decreases, leading to a movement down along the demand curve (from A to B), which matches the graph.

Snap & solve any problem in the app
Get step-by-step solutions on Sovi AI
Photo-based solutions with guided steps
Explore more problems and detailed explanations
D. an increase in quantity demanded