QUESTION IMAGE
Question
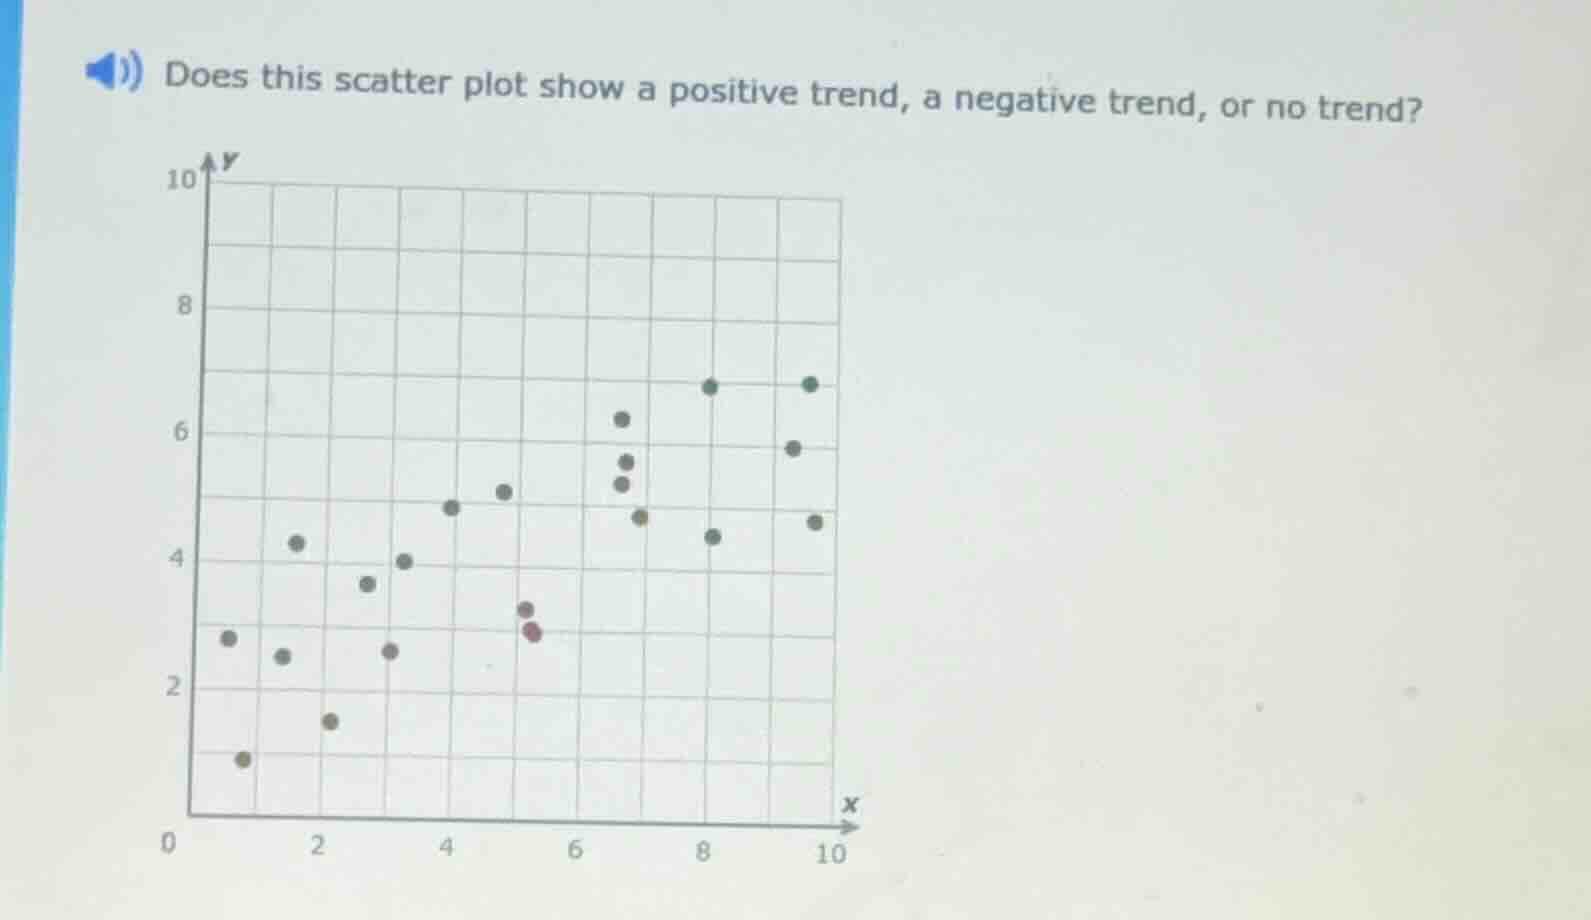
does this scatter plot show a positive trend, a negative trend, or no trend?
Step1: Analyze the scatter plot's direction
To determine the trend, we observe the general direction of the points as \( x \) (horizontal axis) increases. A positive trend occurs when \( y \) (vertical axis) values tend to increase with \( x \); a negative trend when \( y \) decreases with \( x \); no trend if there's no clear pattern.
Looking at the scatter plot, as \( x \) values (from 0 to 10) increase, the \( y \) values of the points generally rise. For example, at \( x = 0 \), \( y \) is around 1 - 3; at \( x = 10 \), \( y \) is around 4 - 7, showing an upward pattern.
Step2: Confirm the trend type
Since the points show a pattern where an increase in \( x \) is associated with an increase in \( y \), this fits the definition of a positive trend. There's no clear negative slope (decreasing \( y \) with \( x \)) or randomness (no trend).

Snap & solve any problem in the app
Get step-by-step solutions on Sovi AI
Photo-based solutions with guided steps
Explore more problems and detailed explanations
positive trend