QUESTION IMAGE
Question
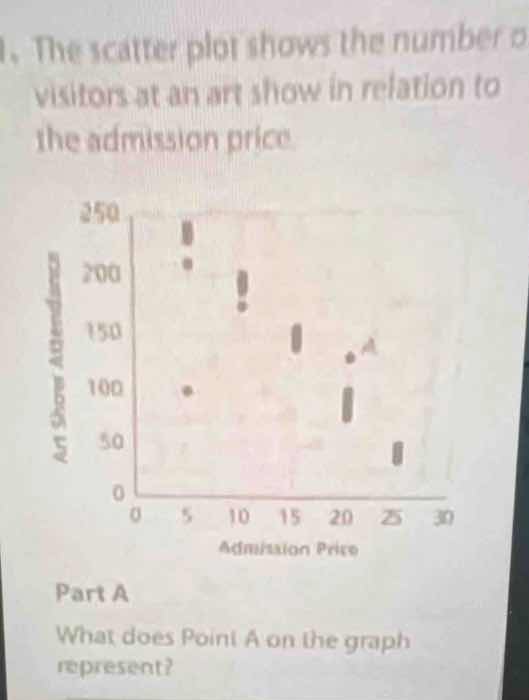
- the scatter plot shows the number of visitors at an art show in relation to the admission price.
part a
what does point a on the graph represent?
Brief Explanations
Point A is located at the intersection of an admission price on the x-axis and an attendance number on the y-axis. Reading the axes, the x-value (admission price) is 22, and the y-value (art show attendance) is 120. This means the point represents when the admission price is set to that value, the number of visitors is the corresponding attendance figure.

Snap & solve any problem in the app
Get step-by-step solutions on Sovi AI
Photo-based solutions with guided steps
Explore more problems and detailed explanations
Point A represents that when the admission price is 22, the art show has an attendance of 120 visitors.