QUESTION IMAGE
Question
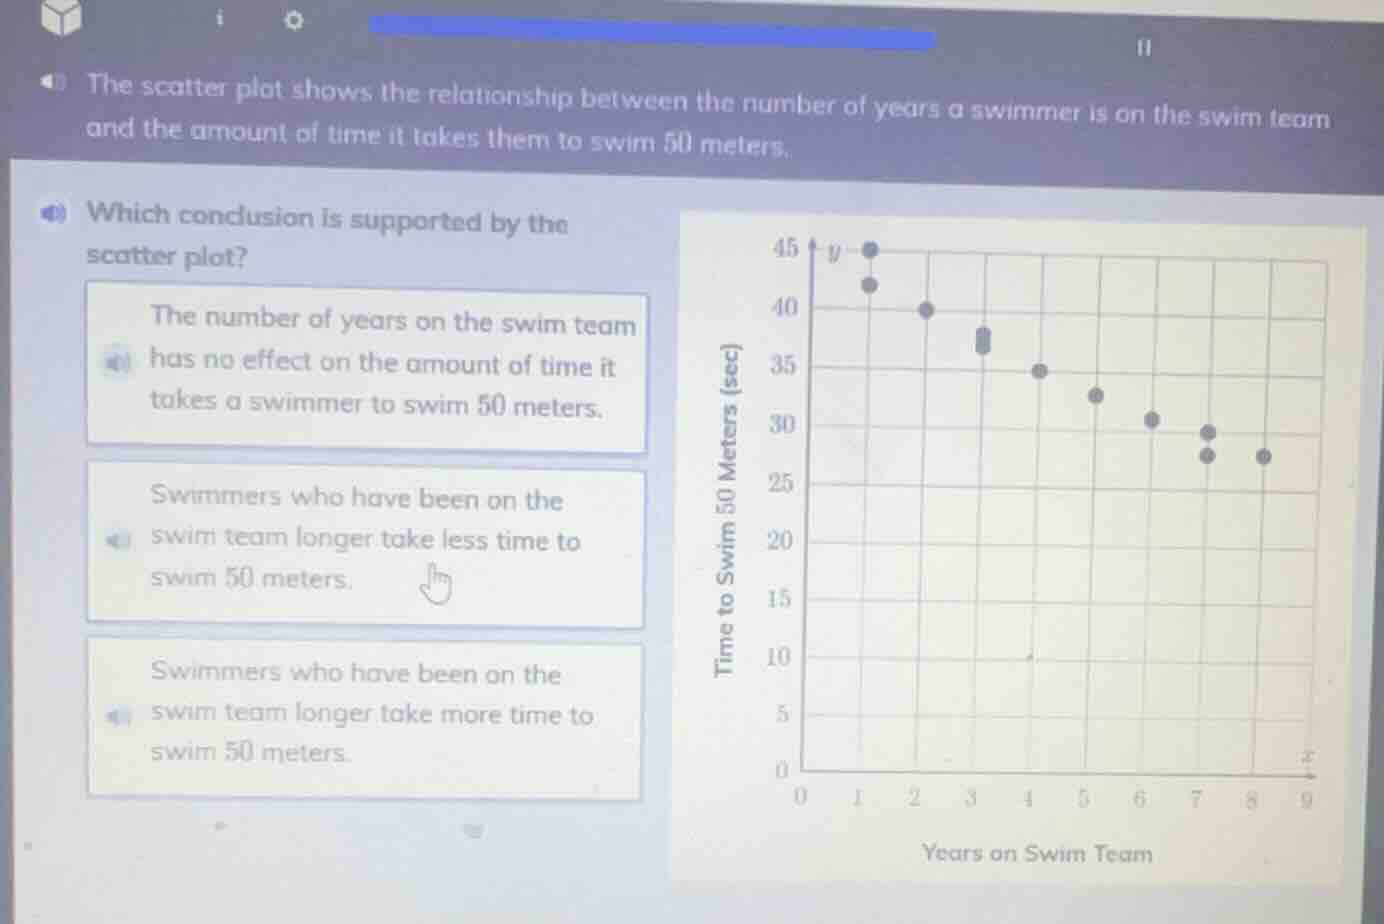
the scatter plot shows the relationship between the number of years a swimmer is on the swim team and the amount of time it takes them to swim 50 meters.
which conclusion is supported by the scatter plot?
the number of years on the swim team has no effect on the amount of time it takes a swimmer to swim 50 meters.
swimmers who have been on the swim team longer take less time to swim 50 meters.
swimmers who have been on the swim team longer take more time to swim 50 meters.
The scatter plot shows a clear downward trend: as the x-value (years on swim team) increases, the y-value (time to swim 50 meters) decreases. This means swimmers with more years on the team have faster (shorter) swim times.

Snap & solve any problem in the app
Get step-by-step solutions on Sovi AI
Photo-based solutions with guided steps
Explore more problems and detailed explanations
Swimmers who have been on the swim team longer take less time to swim 50 meters.