QUESTION IMAGE
Question
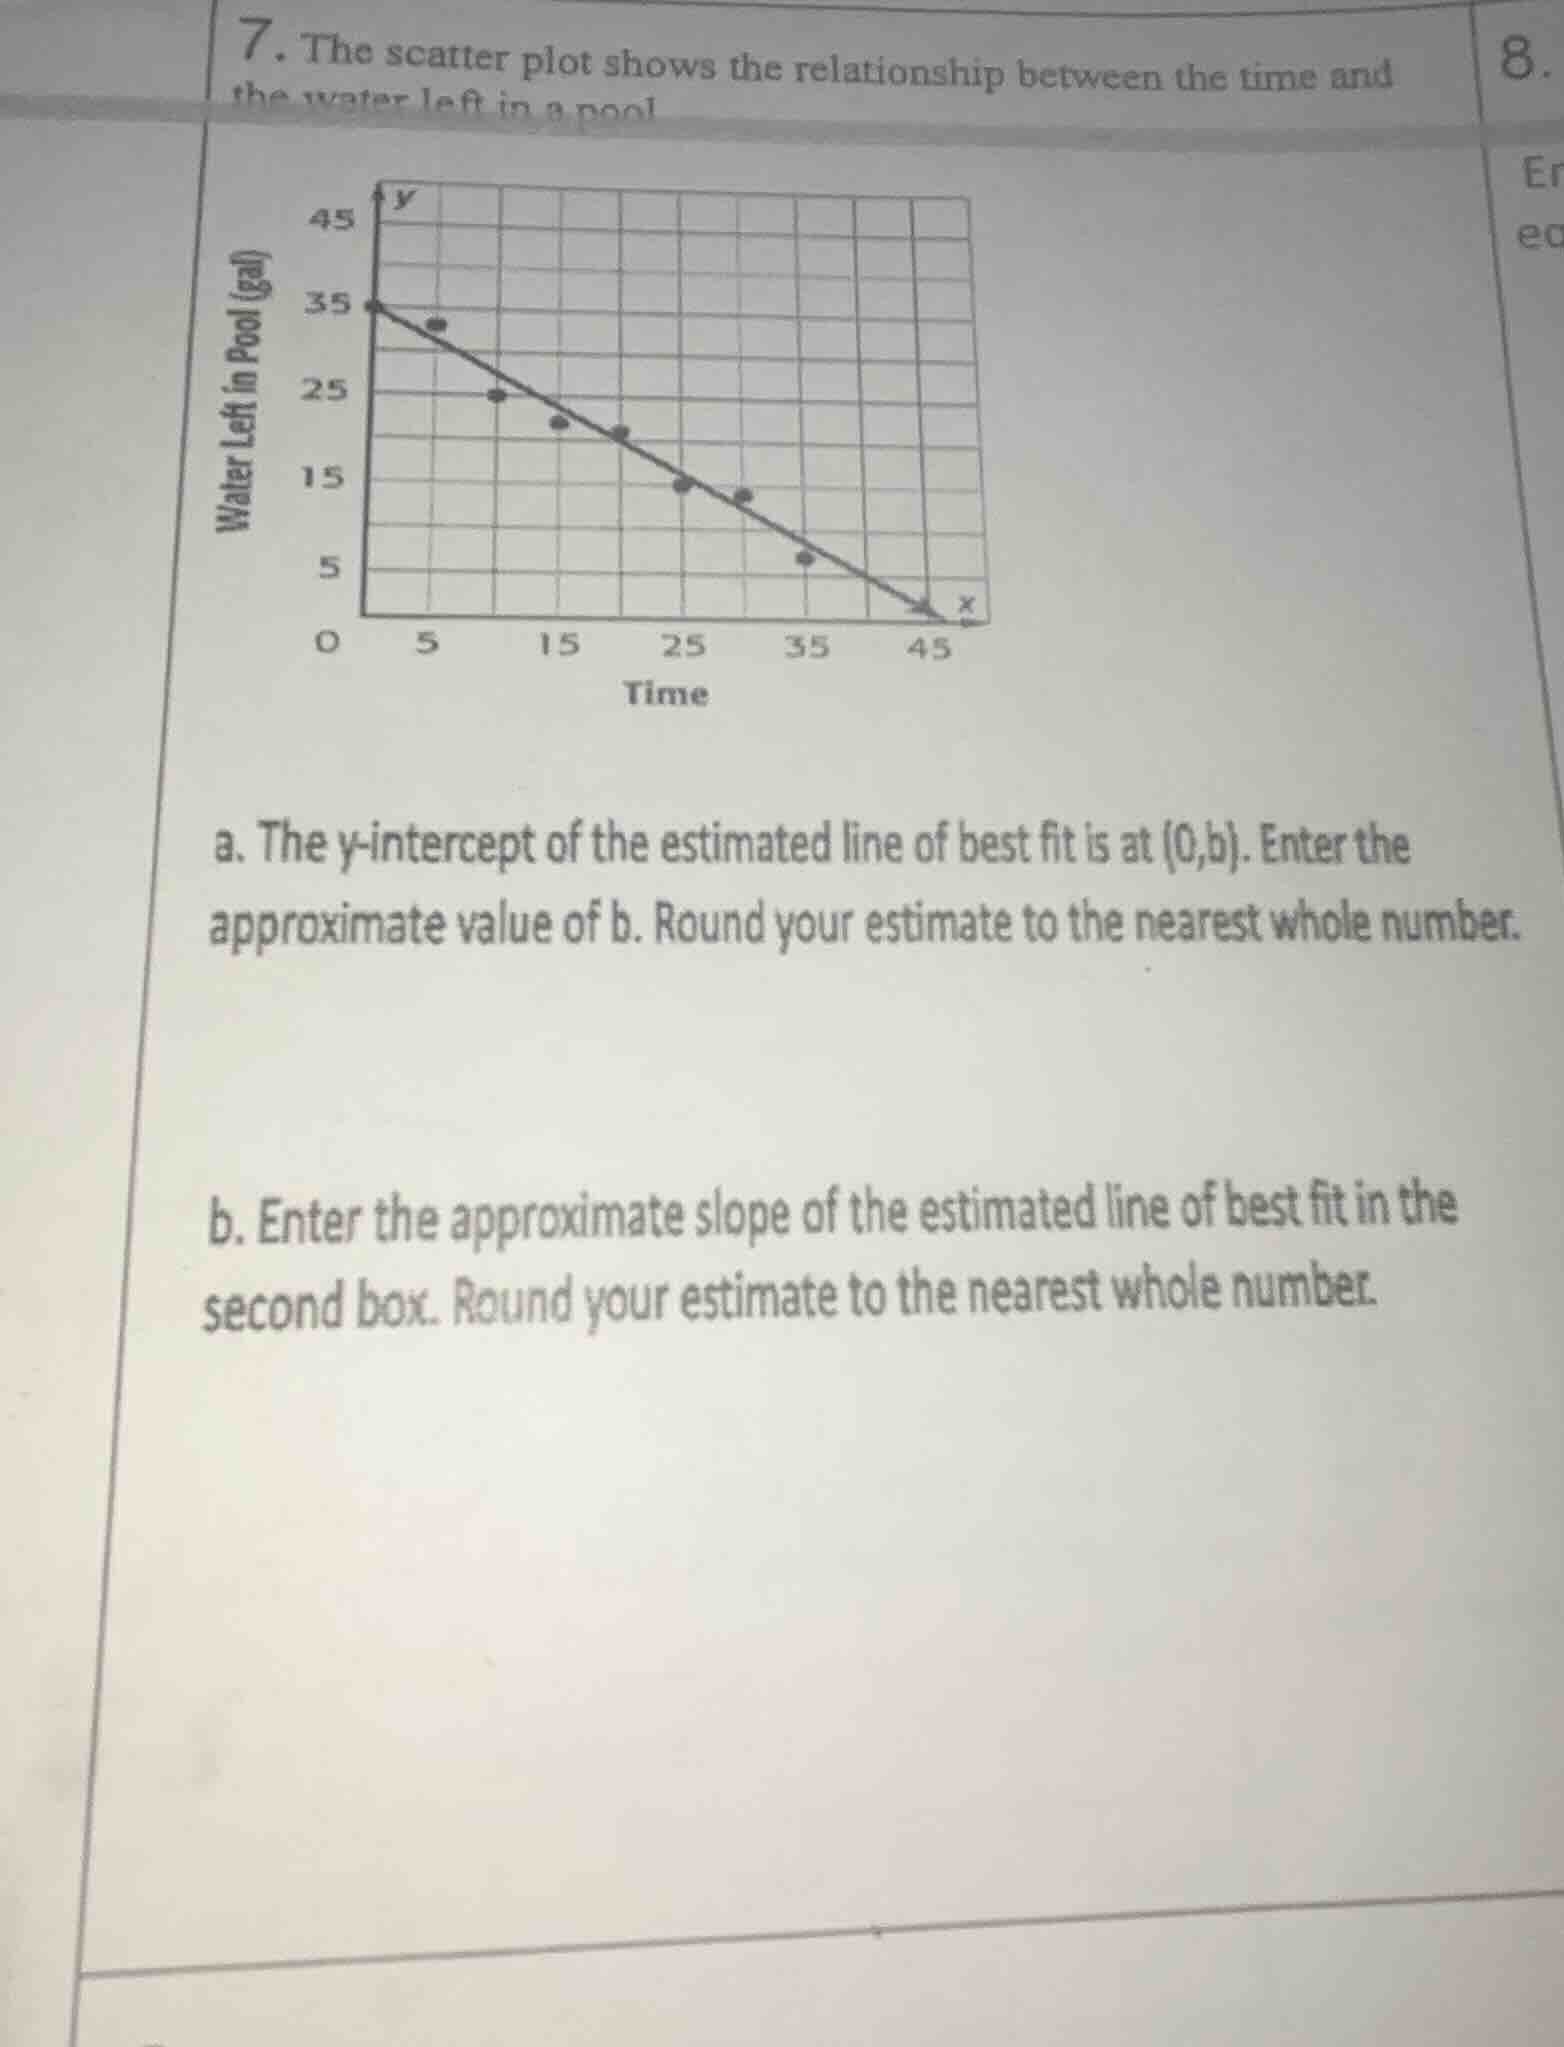
- the scatter plot shows the relationship between the time and the water left in a pool
a. the y - intercept of the estimated line of best fit is at (0, b). enter the approximate value of b. round your estimate to the nearest whole number.
b. enter the approximate slope of the estimated line of best fit in the second box. round your estimate to the nearest whole number.
Part a
Step1: Identify the y - intercept
The y - intercept of a line is the value of \(y\) when \(x = 0\). From the scatter plot and the line of best fit, when \(x=0\) (time = 0), the value of \(y\) (water left in the pool) is 35 (by looking at the point \((0,35)\) on the line).
Step1: Recall the slope formula
The slope \(m\) of a line passing through two points \((x_1,y_1)\) and \((x_2,y_2)\) is given by \(m=\frac{y_2 - y_1}{x_2 - x_1}\).
Step2: Choose two points on the line
We can use the y - intercept \((0,35)\) and another point, say \((45,0)\) (where the line intersects the \(x\) - axis).
Step3: Calculate the slope
Substitute \(x_1 = 0,y_1=35,x_2 = 45,y_2 = 0\) into the slope formula: \(m=\frac{0 - 35}{45-0}=\frac{- 35}{45}\approx - 1\) (rounded to the nearest whole number).

Snap & solve any problem in the app
Get step-by-step solutions on Sovi AI
Photo-based solutions with guided steps
Explore more problems and detailed explanations
35