QUESTION IMAGE
Question
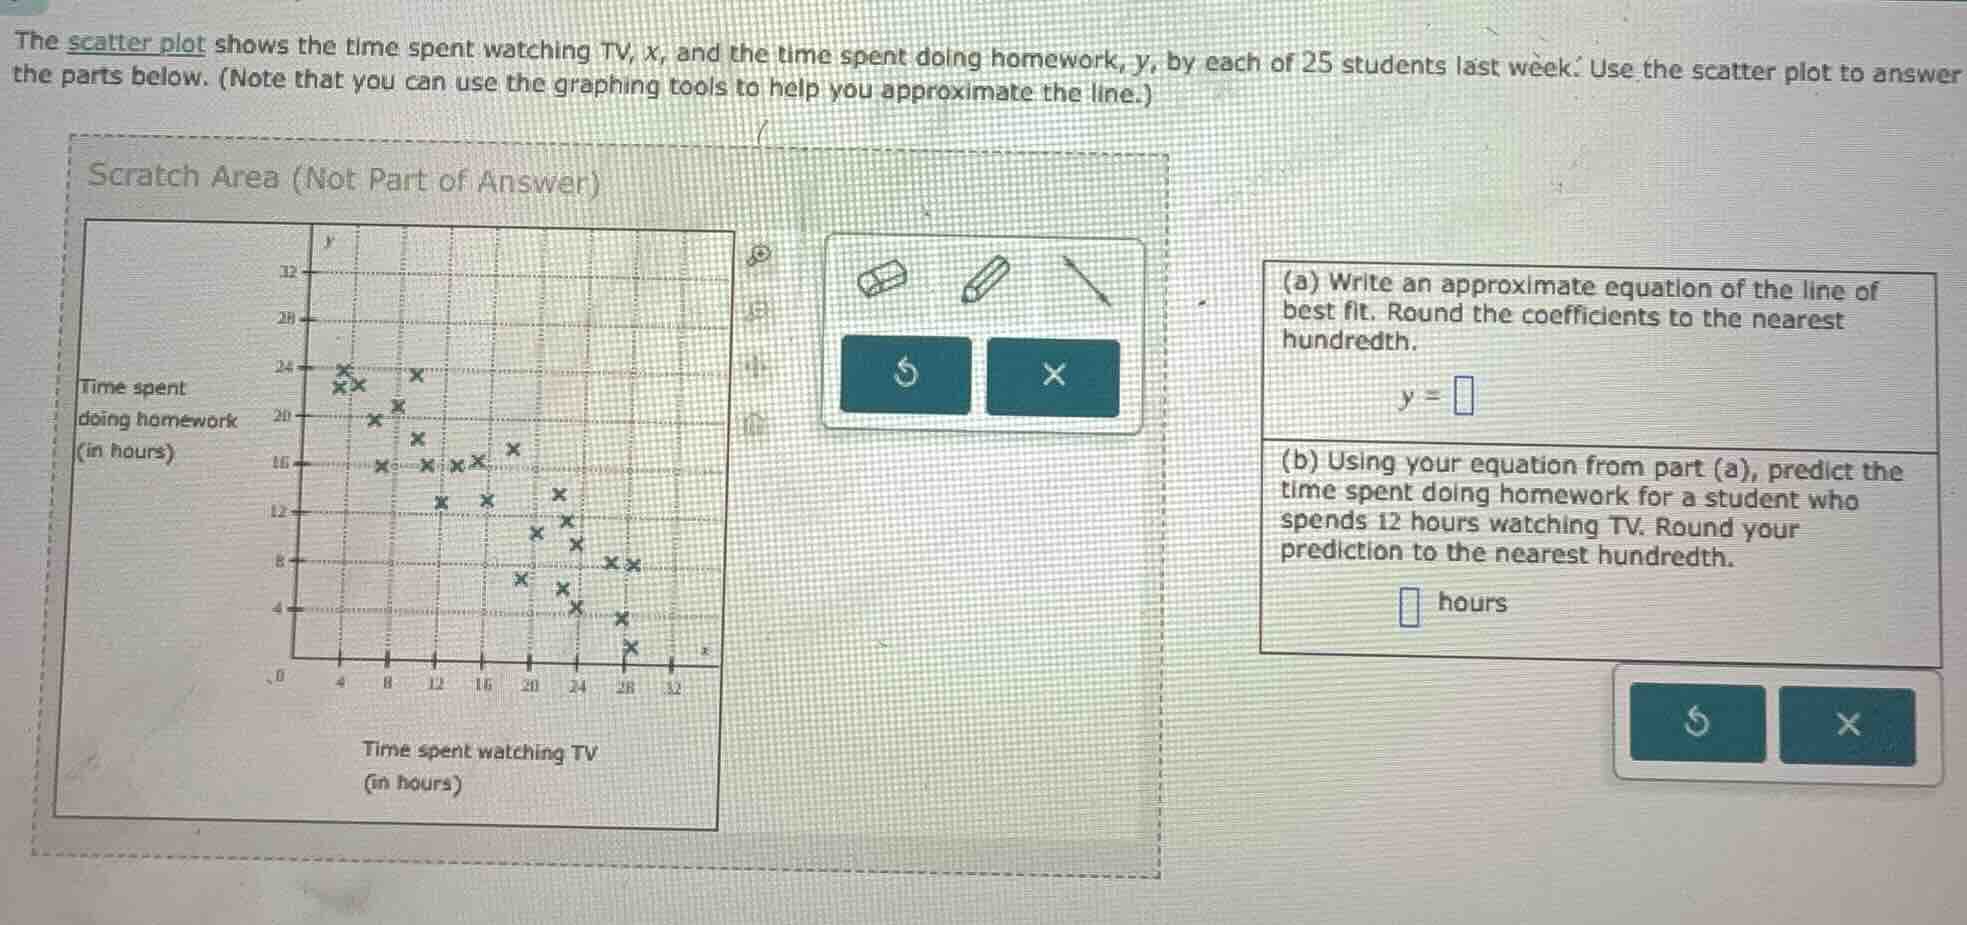
the scatter plot shows the time spent watching tv, x, and the time spent doing homework, y, by each of 25 students last week. use the scatter plot to answer the parts below. (note that you can use the graphing tools to help you approximate the line.) (a) write an approximate equation of the line of best fit. round the coefficients to the nearest hundredth. \\( y = \square \\) (b) using your equation from part (a), predict the time spent doing homework for a student who spends 12 hours watching tv. round your prediction to the nearest hundredth. \\( \square \\) hours
Step1: Identify two points on trend line
Choose points (4, 23) and (28, 6) (approximate from scatter plot)
Step2: Calculate slope
Slope $m = \frac{y_2 - y_1}{x_2 - x_1} = \frac{6 - 23}{28 - 4} = \frac{-17}{24} \approx -0.71$
Step3: Find y-intercept $b$
Use $y = mx + b$, substitute (4,23):
$23 = -0.71(4) + b$
$23 = -2.84 + b$
$b = 23 + 2.84 = 25.84$
Step4: Write line of best fit
$y = -0.71x + 25.84$
Step5: Predict for $x=12$
Substitute $x=12$ into the equation:
$y = -0.71(12) + 25.84$
$y = -8.52 + 25.84 = 17.32$

Snap & solve any problem in the app
Get step-by-step solutions on Sovi AI
Photo-based solutions with guided steps
Explore more problems and detailed explanations
(a) $y = -0.71x + 25.84$
(b) 17.32 hours