QUESTION IMAGE
Question
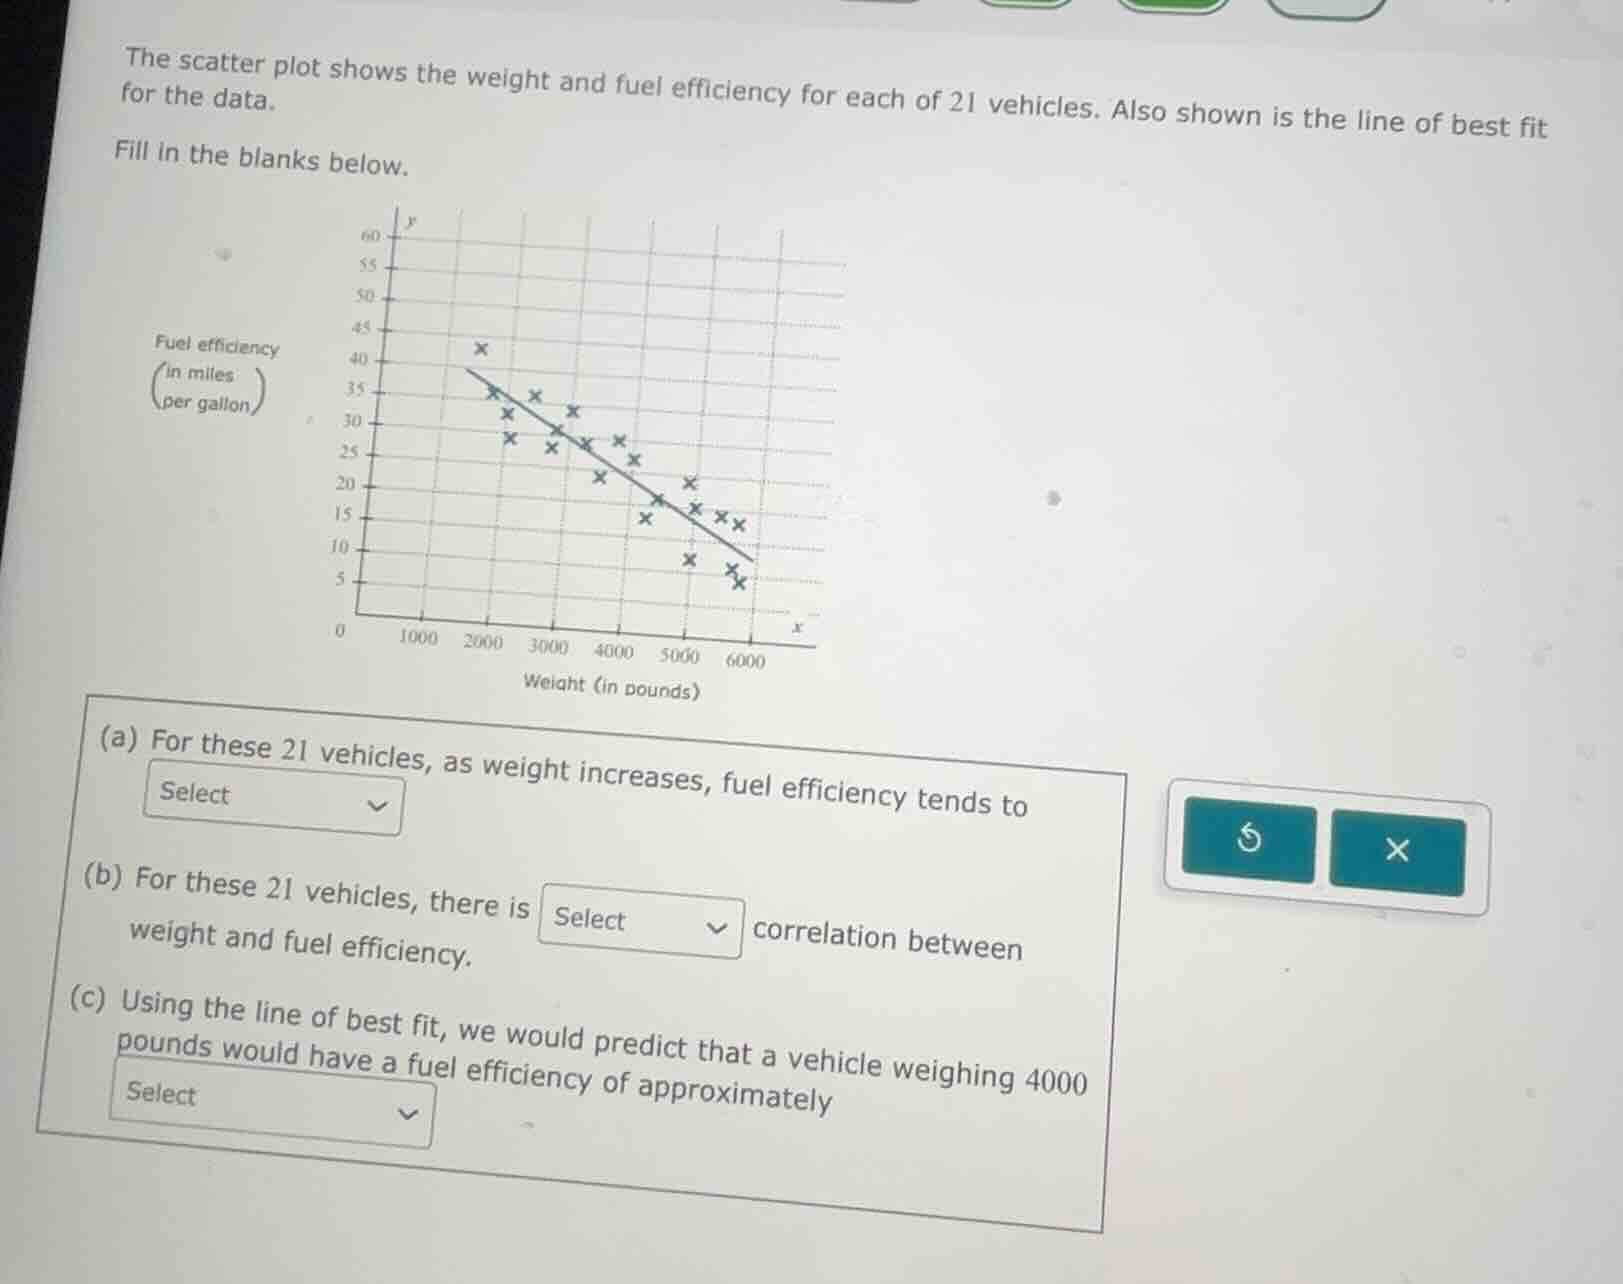
the scatter plot shows the weight and fuel efficiency for each of 21 vehicles. also shown is the line of best fit for the data. fill in the blanks below. (a) for these 21 vehicles, as weight increases, fuel efficiency tends to select (b) for these 21 vehicles, there is select correlation between weight and fuel efficiency. (c) using the line of best fit, we would predict that a vehicle weighing 4000 pounds would have a fuel efficiency of approximately select
Part (a)
Looking at the scatter plot and the line of best fit, as the weight (x - axis) increases, the fuel efficiency (y - axis) values on the line of best fit and the scatter points show a downward trend. So fuel efficiency tends to decrease.
Since as weight increases, fuel efficiency decreases, and the points follow a somewhat linear (negative slope) pattern, the correlation between weight and fuel efficiency is negative.
To find the predicted fuel efficiency for a 4000 - pound vehicle, we look at the line of best fit. When \(x = 4000\) (weight in pounds), we find the corresponding \(y\) - value (fuel efficiency) on the line of best fit. From the graph, when \(x = 4000\), the \(y\) - value on the line of best fit is approximately 20 miles per gallon (by looking at the grid, at \(x = 4000\), the line is around \(y = 20\)).

Snap & solve any problem in the app
Get step-by-step solutions on Sovi AI
Photo-based solutions with guided steps
Explore more problems and detailed explanations
decrease