QUESTION IMAGE
Question
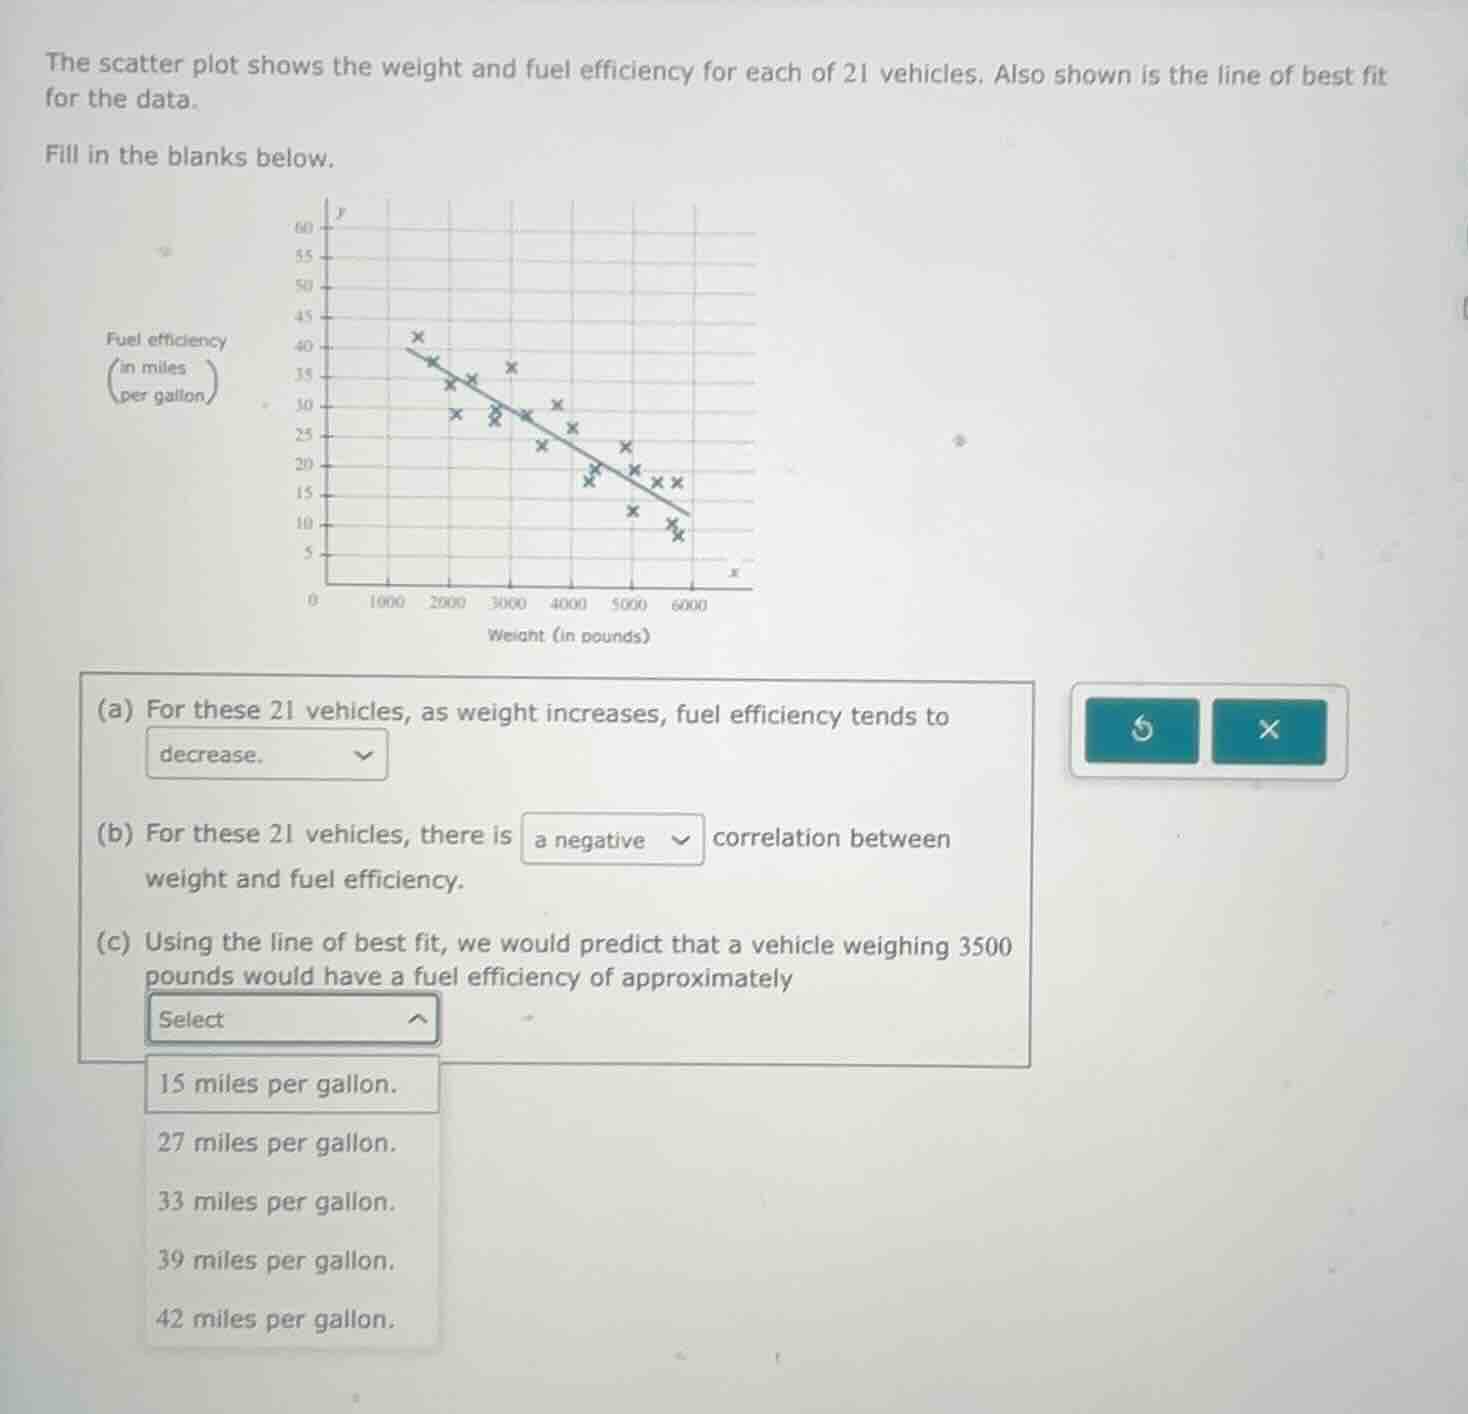
the scatter plot shows the weight and fuel efficiency for each of 21 vehicles. also shown is the line of best fit for the data.
fill in the blanks below.
(a) for these 21 vehicles, as weight increases, fuel efficiency tends to decrease.
(b) for these 21 vehicles, there is a negative correlation between weight and fuel efficiency.
(c) using the line of best fit, we would predict that a vehicle weighing 3500 pounds would have a fuel efficiency of approximately
15 miles per gallon.
27 miles per gallon.
33 miles per gallon.
39 miles per gallon.
42 miles per gallon.
Part (a)
Step1: Analyze the scatter plot trend
The line of best fit has a negative slope (going down from left to right), and the scatter points follow this trend. As weight (x - axis) increases, fuel efficiency (y - axis) values on the line and the points show a downward trend. So fuel efficiency tends to decrease.
Step1: Determine correlation type
A negative correlation exists when one variable increases and the other decreases. Here, as weight (x) increases, fuel efficiency (y) decreases, so the correlation is negative.
Step1: Locate x = 3500 on the plot
Find the x - value of 3500 pounds on the weight axis. Then, find the corresponding y - value (fuel efficiency) on the line of best fit. Looking at the scatter plot, when x = 3500, the line of best fit is around y = 27 miles per gallon (comparing with the y - axis scale and the position of the line at x = 3500). The other options (15 is too low, 33, 39, 42 are too high as per the negative trend and the line's position at x = 3500).

Snap & solve any problem in the app
Get step-by-step solutions on Sovi AI
Photo-based solutions with guided steps
Explore more problems and detailed explanations
decrease