QUESTION IMAGE
Question
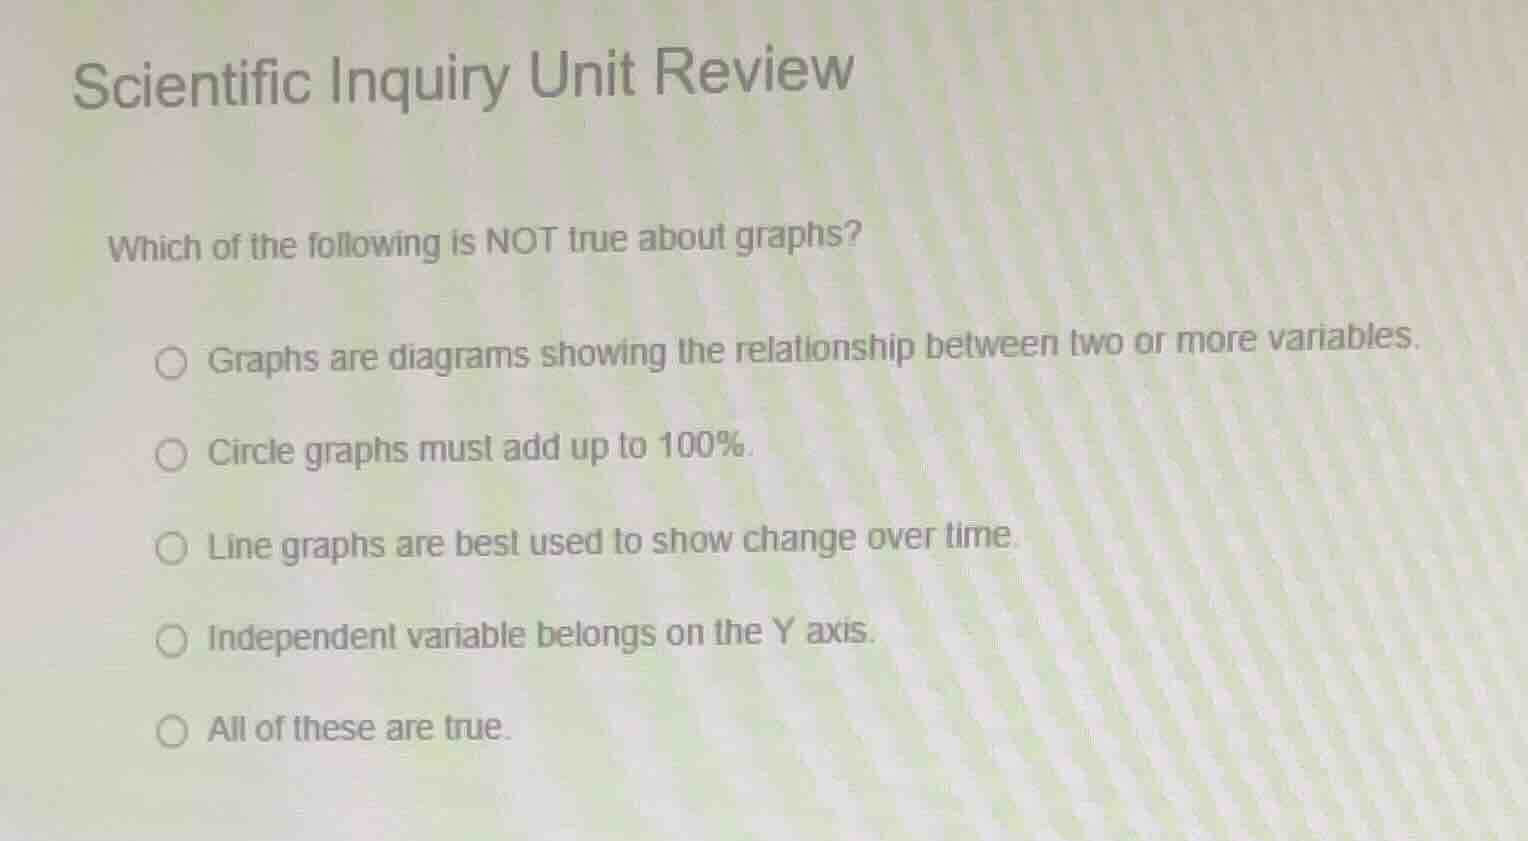
scientific inquiry unit review
which of the following is not true about graphs?
○ graphs are diagrams showing the relationship between two or more variables.
○ circle graphs must add up to 100%.
○ line graphs are best used to show change over time.
○ independent variable belongs on the y axis.
○ all of these are true.
Brief Explanations
- Graphs are defined as diagrams showing relationships between variables, so the first statement is true.
- Circle (pie) graphs represent parts of a whole, so their sections must sum to 100%, making the second statement true.
- Line graphs are designed to visualize trends and changes over a continuous variable like time, so the third statement is true.
- In standard graphing conventions, the independent variable is placed on the X-axis, while the dependent variable goes on the Y-axis, making the fourth statement false.

Snap & solve any problem in the app
Get step-by-step solutions on Sovi AI
Photo-based solutions with guided steps
Explore more problems and detailed explanations
Independent variable belongs on the Y axis.