QUESTION IMAGE
Question
(score for question 1: ___ of 4 points)
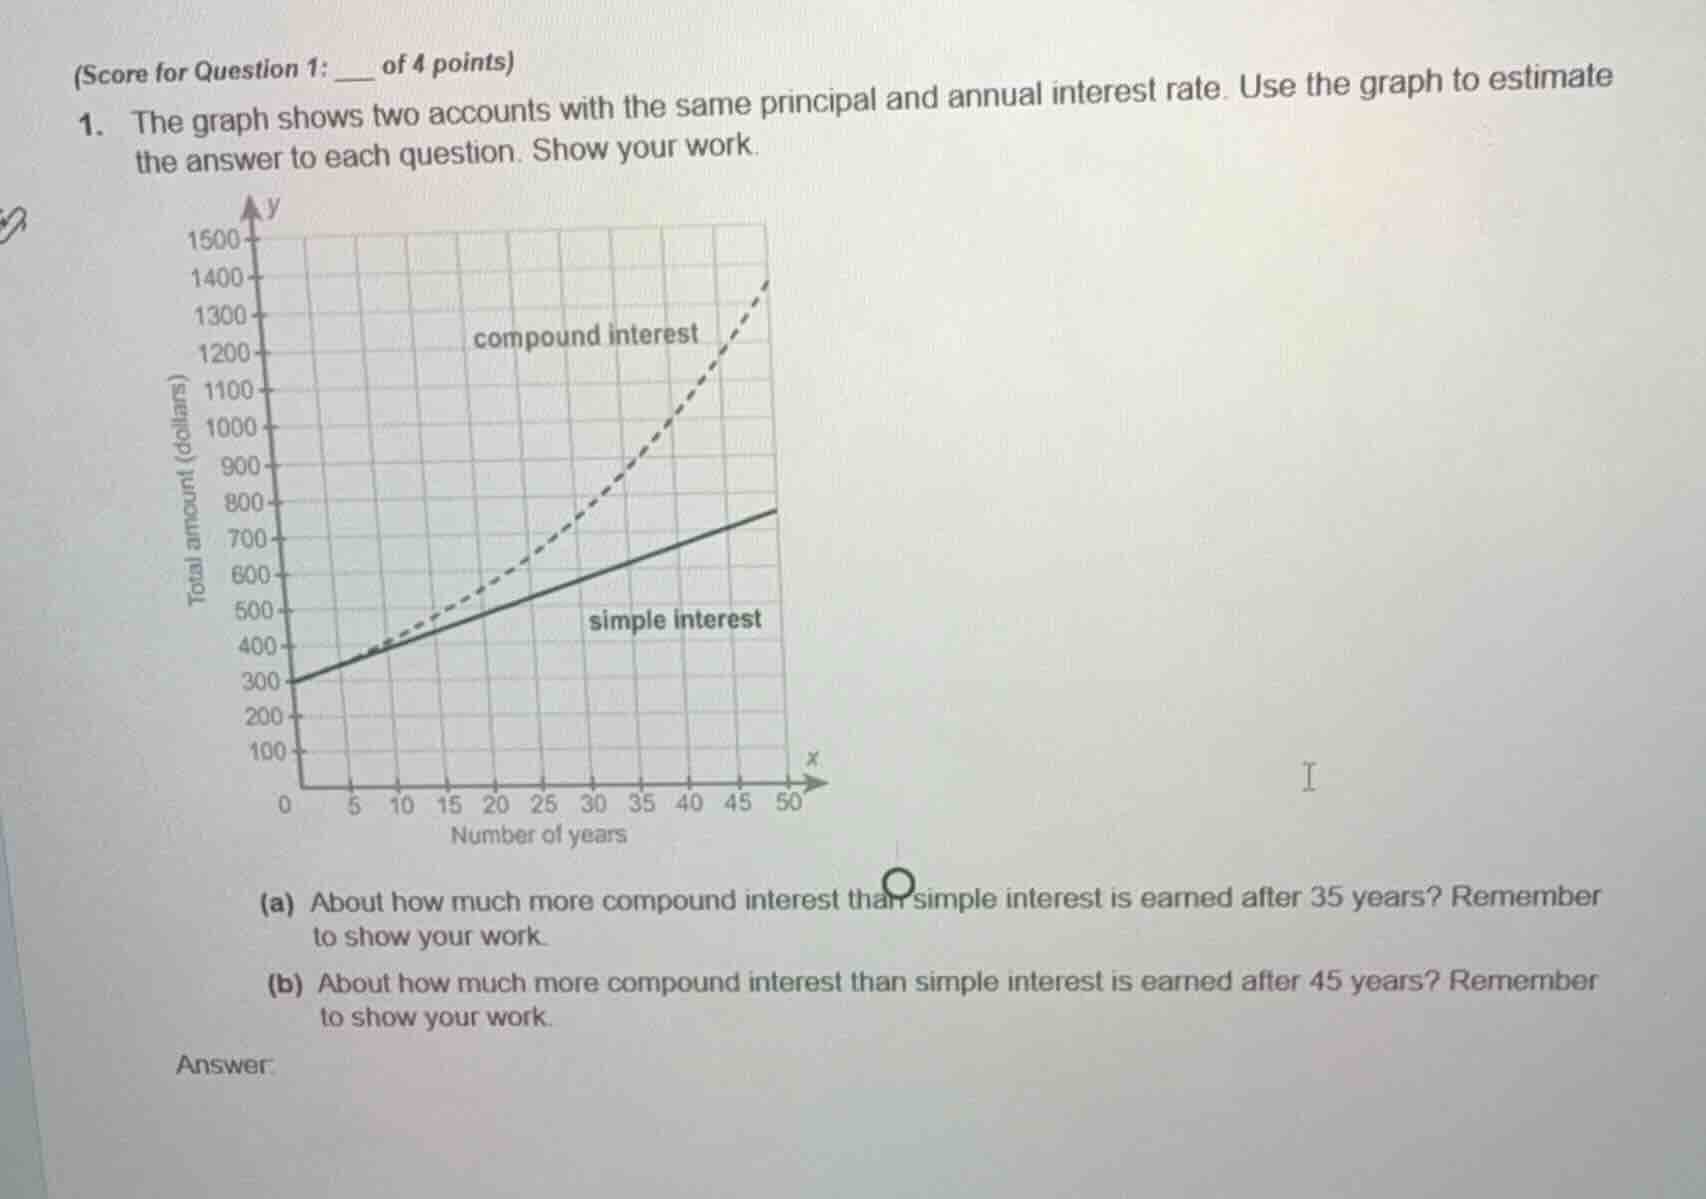
- the graph shows two accounts with the same principal and annual interest rate. use the graph to estimate the answer to each question. show your work.
(a) about how much more compound interest than simple interest is earned after 35 years? remember to show your work.
(b) about how much more compound interest than simple interest is earned after 45 years? remember to show your work.
answer:
Part (a)
Step1: Find compound interest at 35 years
From the graph, the compound interest (dashed line) at \( x = 35 \) years has a \( y \)-value (total amount) of approximately \( \$900 \).
Step2: Find simple interest at 35 years
From the graph, the simple interest (solid line) at \( x = 35 \) years has a \( y \)-value (total amount) of approximately \( \$600 \).
Step3: Calculate the difference
Subtract the simple interest total from the compound interest total: \( 900 - 600 = 300 \).
Step1: Find compound interest at 45 years
From the graph, the compound interest (dashed line) at \( x = 45 \) years has a \( y \)-value (total amount) of approximately \( \$1200 \).
Step2: Find simple interest at 45 years
From the graph, the simple interest (solid line) at \( x = 45 \) years has a \( y \)-value (total amount) of approximately \( \$700 \).
Step3: Calculate the difference
Subtract the simple interest total from the compound interest total: \( 1200 - 700 = 500 \).

Snap & solve any problem in the app
Get step-by-step solutions on Sovi AI
Photo-based solutions with guided steps
Explore more problems and detailed explanations
About \(\$300\) more compound interest is earned after 35 years.