QUESTION IMAGE
Question
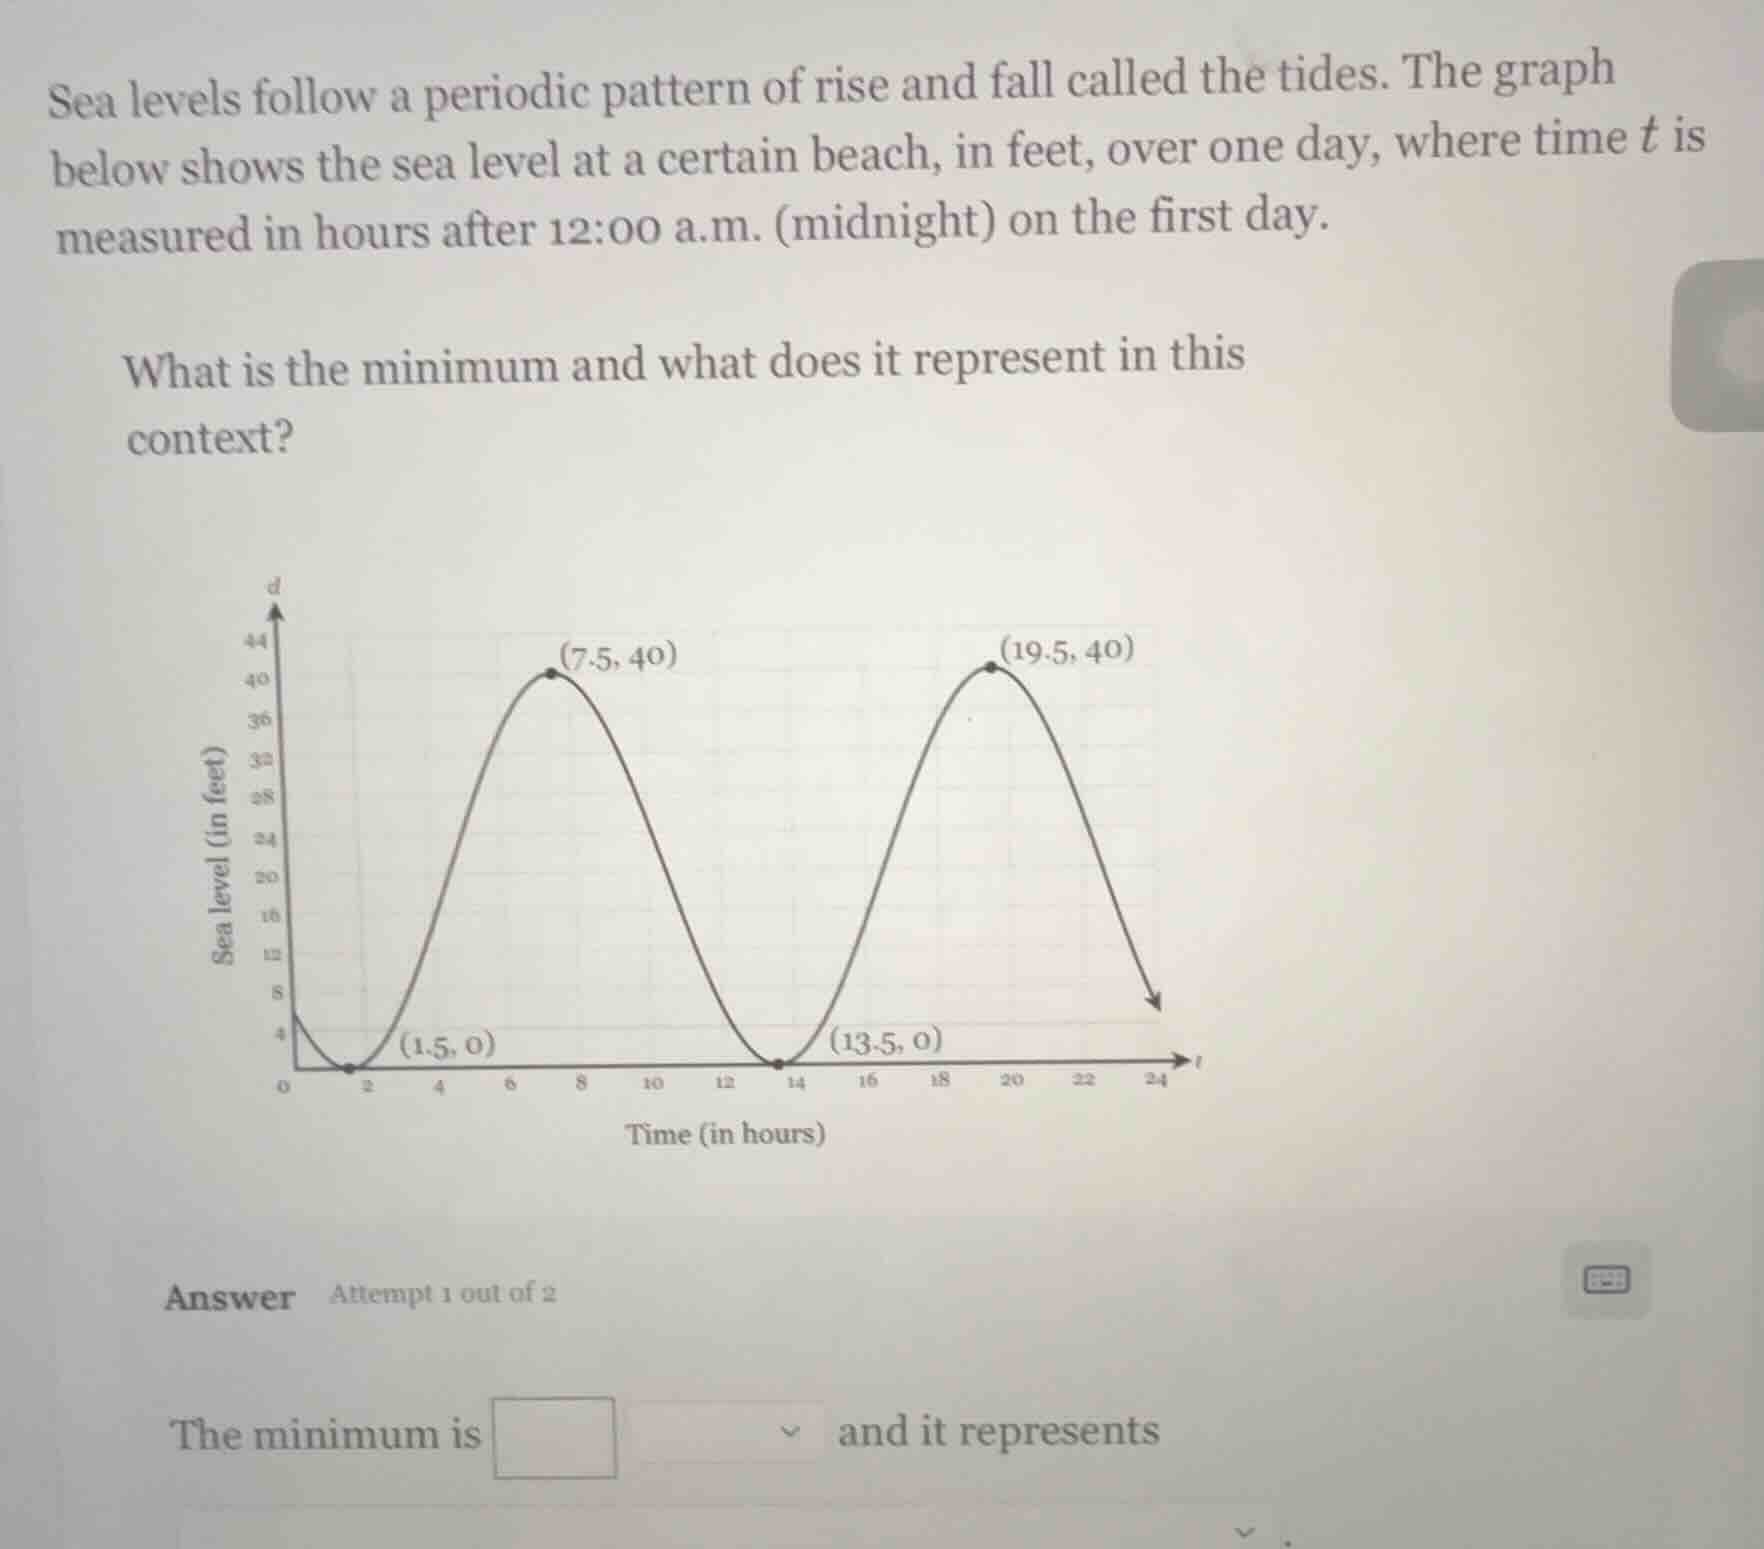
sea levels follow a periodic pattern of rise and fall called the tides. the graph below shows the sea level at a certain beach, in feet, over one day, where time t is measured in hours after 12:00 a.m. (midnight) on the first day. what is the minimum and what does it represent in this context? graph of sea level vs. time with points (7.5, 40), (19.5, 40), (1.5, 0), (13.5, 0) and time from 0 to 24 hours, sea level from 0 to 44 feet
- Identify the lowest value on the graph's sea level (d-axis). The points (1.5, 0) and (13.5, 0) show the lowest sea level value is 0 feet.
- Interpret the context: the minimum sea level value represents the lowest height the ocean reaches at this beach, occurring at 1:30 a.m. (1.5 hours after midnight) and 1:30 p.m. (13.5 hours after midnight).

Snap & solve any problem in the app
Get step-by-step solutions on Sovi AI
Photo-based solutions with guided steps
Explore more problems and detailed explanations
The minimum is 0 feet, and it represents the lowest sea level (low tide) at the beach, which occurs 1.5 hours (1:30 a.m.) and 13.5 hours (1:30 p.m.) after midnight.