QUESTION IMAGE
Question
section 4.1: correlation
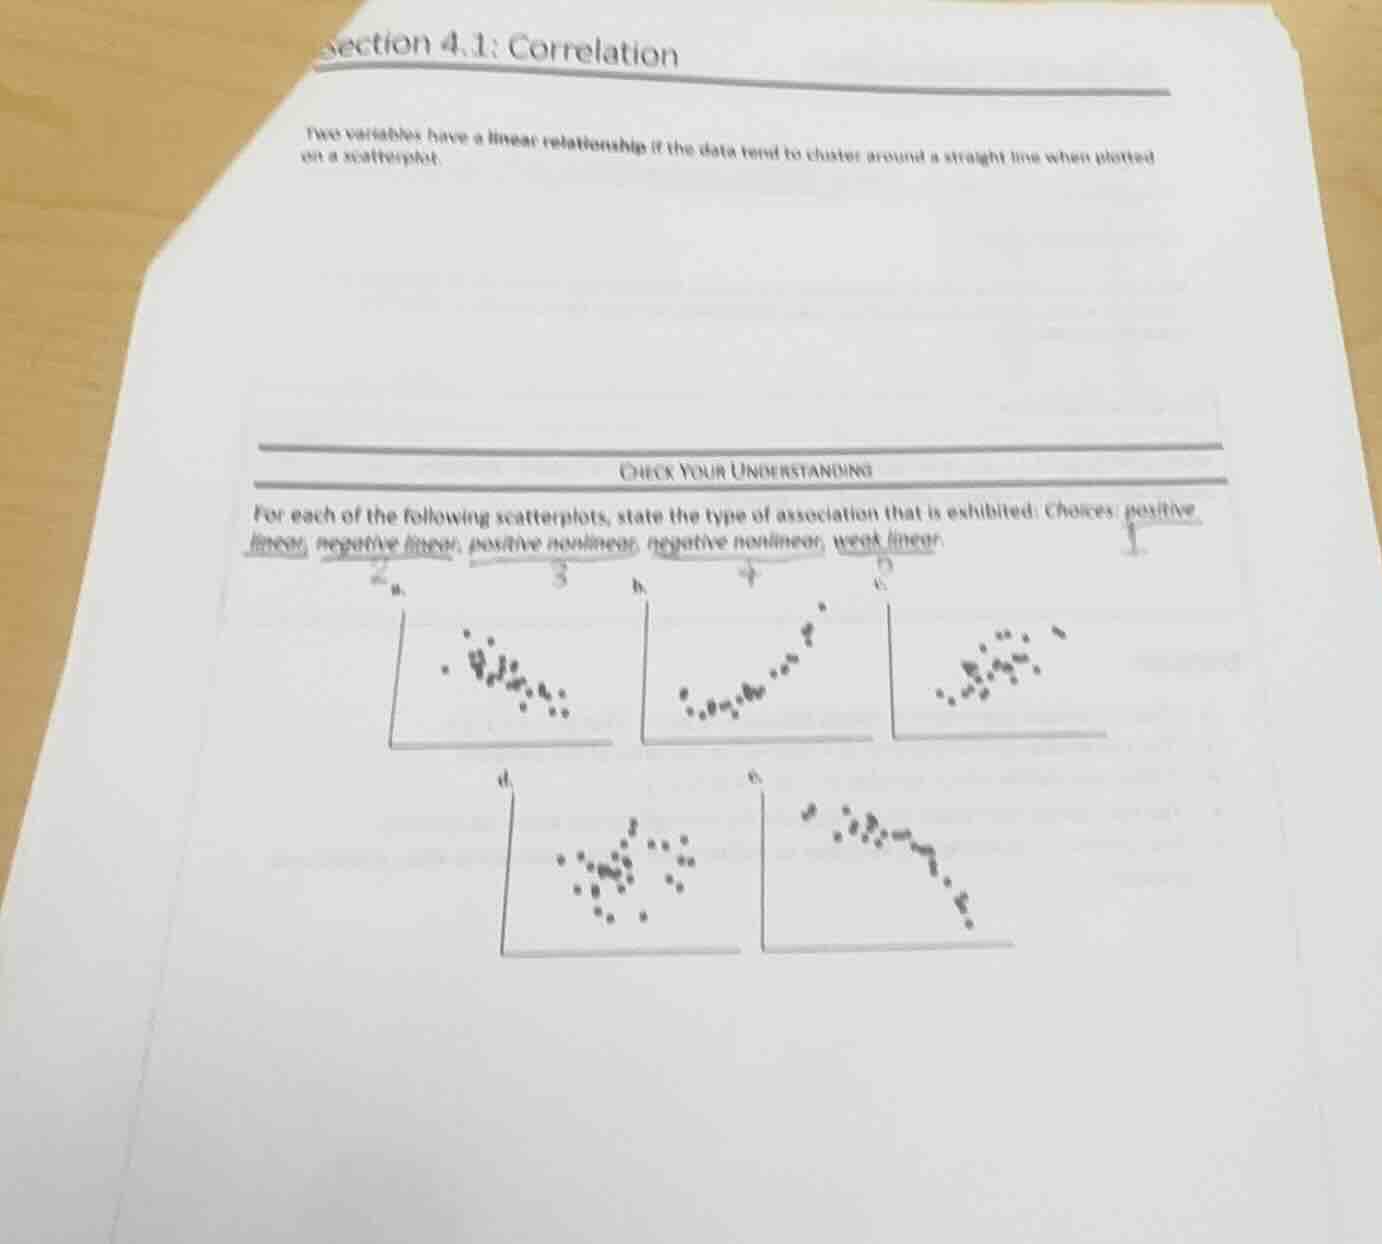
two variables have a linear relationship if the data tend to cluster around a straight line when plotted on a scatterplot.
check your understanding
for each of the following scatterplots, state the type of association that is exhibited: choices: positive linear, negative linear, positive nonlinear, negative nonlinear, weak linear
Brief Explanations
- Scatterplot a: Data clusters along a downward-sloping straight line, so it has a negative linear association.
- Scatterplot b: Data clusters along an upward-sloping straight line, so it has a positive linear association.
- Scatterplot c: Data loosely follows an upward-sloping straight line with weak clustering, so it has a weak linear association.
- Scatterplot d: Data shows no clear linear or nonlinear trend, with very weak clustering, so it has a weak linear association.
- Scatterplot e: Data follows a downward-sloping curved pattern, so it has a negative nonlinear association.

Snap & solve any problem in the app
Get step-by-step solutions on Sovi AI
Photo-based solutions with guided steps
Explore more problems and detailed explanations
a. negative linear
b. positive linear
c. weak linear
d. weak linear
e. negative nonlinear