QUESTION IMAGE
Question
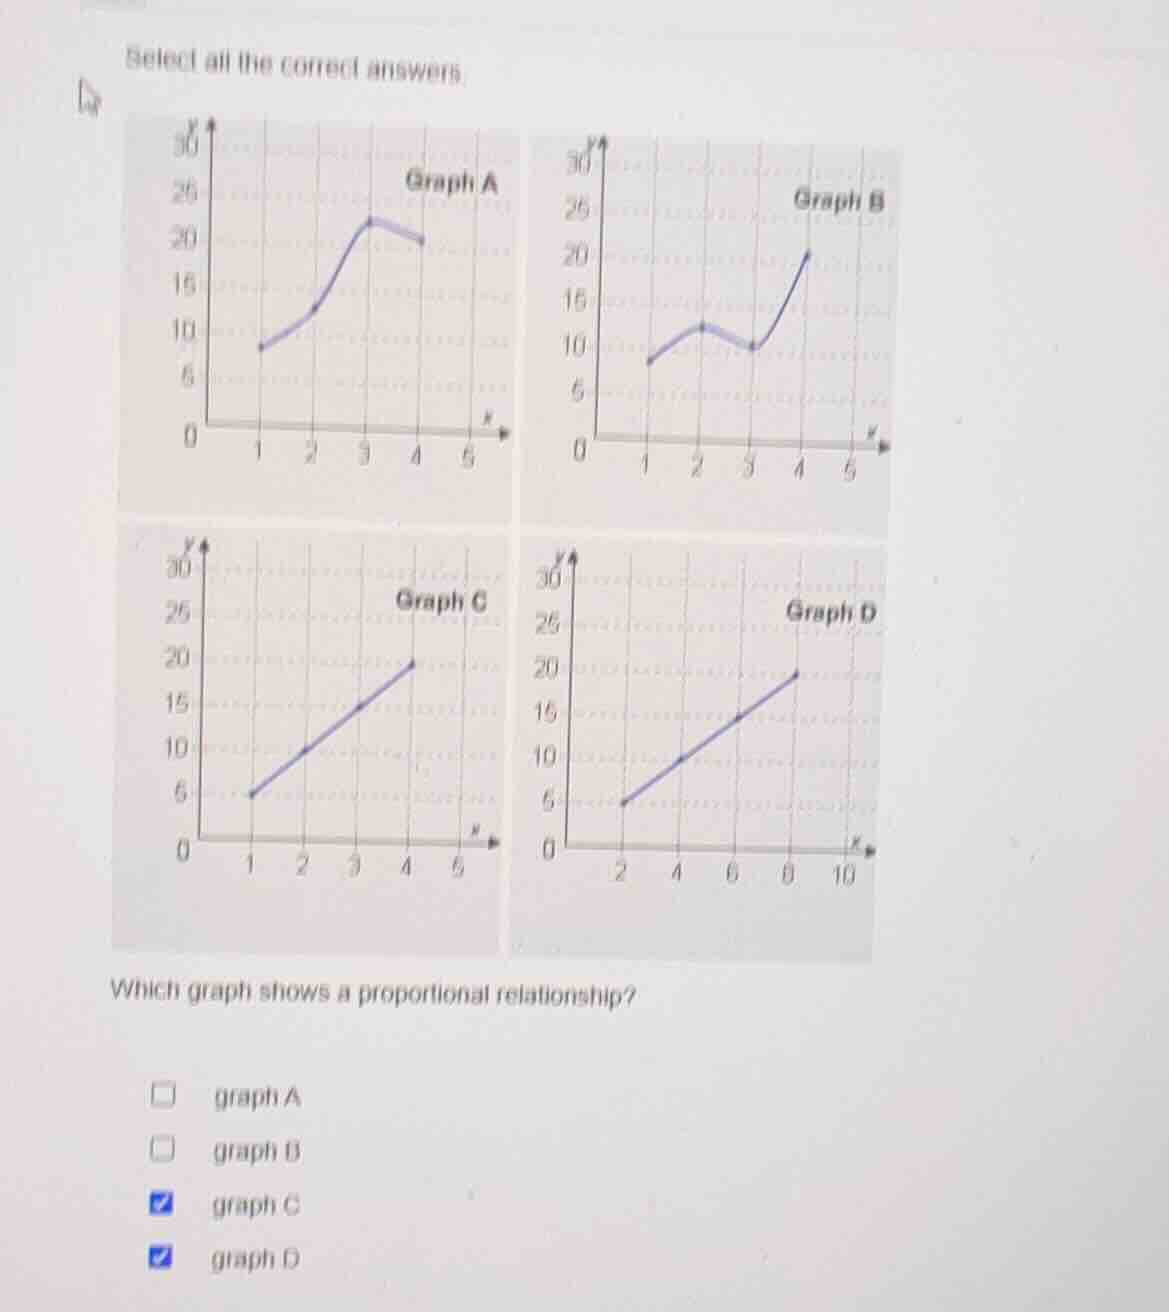
select all the correct answers
graphs a, b, c, d as shown
which graph shows a proportional relationship?
□ graph a
□ graph b
☑ graph c
☑ graph d
Step1: Define proportional relationship
A proportional relationship is defined by the equation $y = kx$ where $k$ is a constant, and its graph is a straight line passing through the origin $(0,0)$ with a constant slope.
Step2: Evaluate Graph A
Graph A is a curved line with changing slope, so it does not represent $y=kx$.
Step3: Evaluate Graph B
Graph B has a non-constant slope (increases, decreases, then increases) and does not follow a straight line through the origin, so it is not proportional.
Step4: Evaluate Graph C
Graph C is a straight line passing through the origin. Calculate the constant slope:
$k = \frac{y}{x} = \frac{5}{1} = \frac{10}{2} = \frac{15}{3} = \frac{20}{4} = 5$, so it follows $y=5x$, a proportional relationship.
Step5: Evaluate Graph D
Graph D is a straight line passing through the origin. Calculate the constant slope:
$k = \frac{y}{x} = \frac{5}{2} = \frac{10}{4} = \frac{15}{6} = \frac{20}{8} = 2.5$, so it follows $y=2.5x$, a proportional relationship.

Snap & solve any problem in the app
Get step-by-step solutions on Sovi AI
Photo-based solutions with guided steps
Explore more problems and detailed explanations
C. graph C, D. graph D