QUESTION IMAGE
Question
select the correct answer.
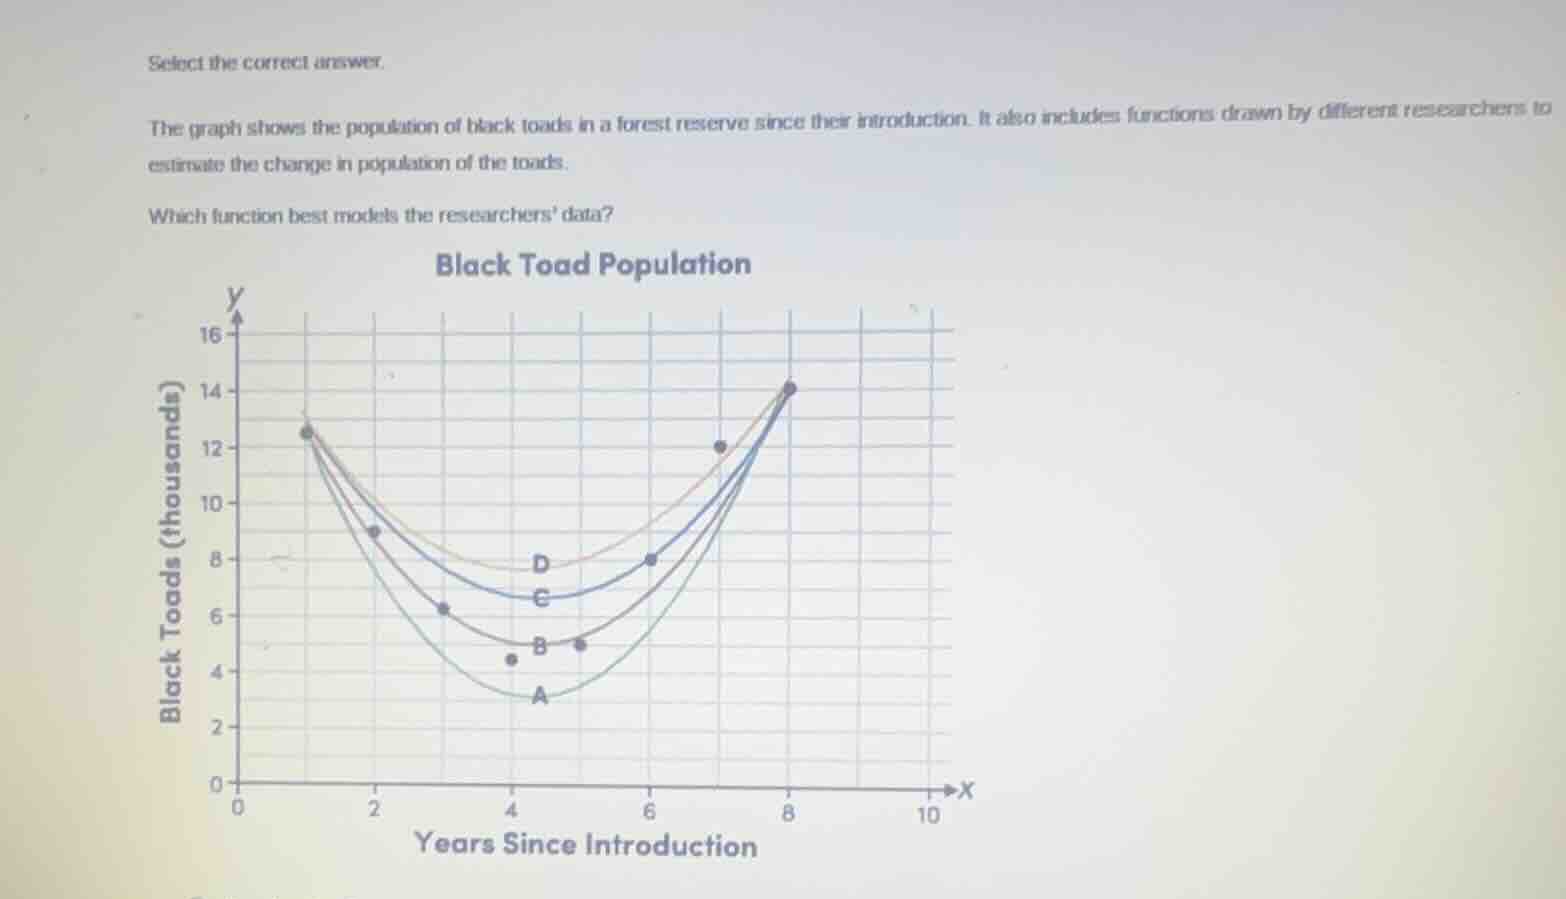
the graph shows the population of black toads in a forest reserve since their introduction. it also includes functions drawn by different researchers to estimate the change in population of the toads.
which function best models the researchers data?
The scatter plot data points follow a curved (parabolic-like) trend that first decreases, reaches a minimum, then increases. Function C passes closest to all the plotted data points, matching the overall trend of the toad population's change over time better than the other functions (A dips too low, B is below most points, D is above most points).

Snap & solve any problem in the app
Get step-by-step solutions on Sovi AI
Photo-based solutions with guided steps
Explore more problems and detailed explanations
C