QUESTION IMAGE
Question
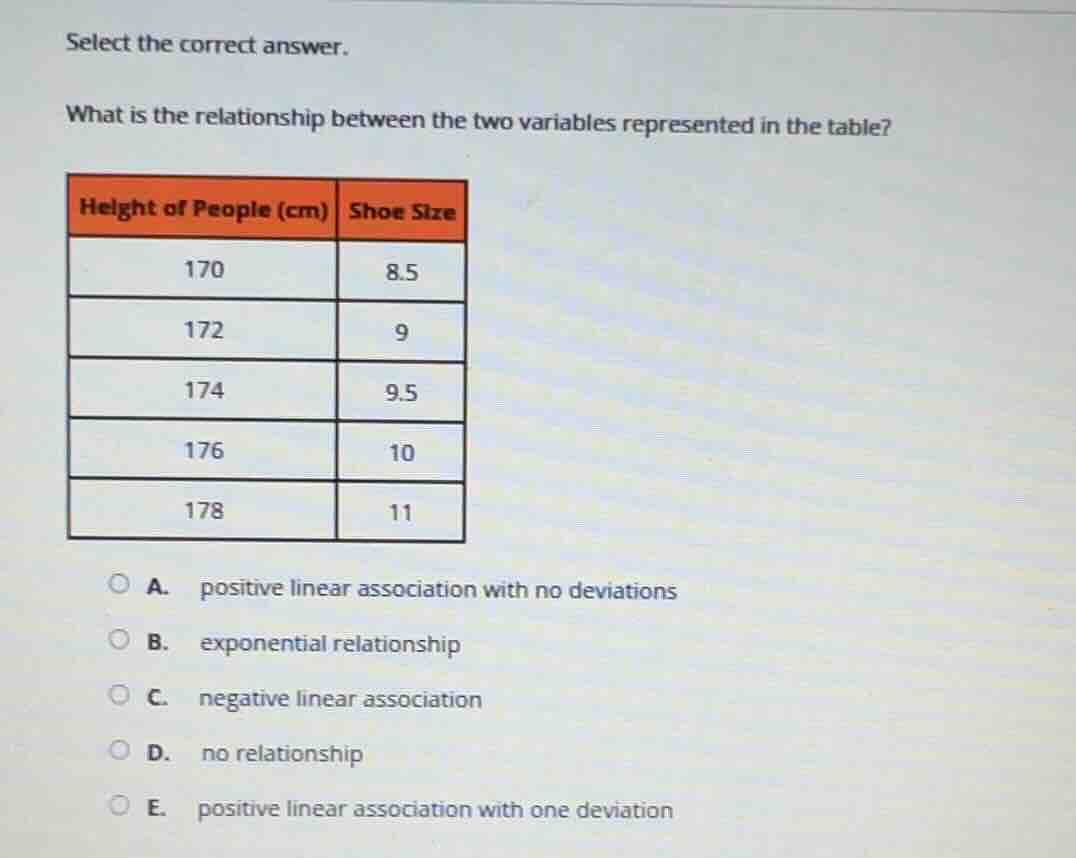
select the correct answer.
what is the relationship between the two variables represented in the table?
| height of people (cm) | shoe size |
|---|---|
| 172 | 9 |
| 174 | 9.5 |
| 176 | 10 |
| 178 | 11 |
a. positive linear association with no deviations
b. exponential relationship
c. negative linear association
d. no relationship
e. positive linear association with one deviation
Brief Explanations
- Analyze the trend of the two variables: As the height of people (in cm) increases (from 170 to 178), the shoe size also generally increases (from 8.5 to 11).
- Check the pattern of increase: The height increases by a constant 2 cm each time. Let's check the shoe size changes: from 8.5 to 9 (increase by 0.5), 9 to 9.5 (increase by 0.5), 9.5 to 10 (increase by 0.5), 10 to 11 (increase by 1). Wait, but overall, the direction is positive. Let's check the linearity. The first four points: height increases by 2, shoe size increases by 0.5 each. The last point: height increases by 2 (from 176 to 178), shoe size increases by 1 (from 10 to 11). Wait, but maybe it's a slight deviation? Wait, no, let's re - check. Wait, the first four: 170→172 (Δh = 2), 8.5→9 (Δs = 0.5); 172→174 (Δh = 2), 9→9.5 (Δs = 0.5); 174→176 (Δh = 2), 9.5→10 (Δs = 0.5); 176→178 (Δh = 2), 10→11 (Δs = 1). Wait, but the general trend is that as height increases, shoe size increases. Now, check the options:
- Option A: positive linear association with no deviations? Wait, the last change in shoe size is 1 instead of 0.5. Wait, maybe I made a mistake. Wait, let's calculate the rate of change. From 170 to 172 (h + 2), s + 0.5; 172 to 174 (h + 2), s + 0.5; 174 to 176 (h + 2), s + 0.5; 176 to 178 (h + 2), s + 1. Wait, but maybe the question considers the overall linear trend. Wait, the first four points have a constant rate of change (slope = 0.5/2 = 0.25), and the last point: slope=(11 - 10)/(178 - 176)=1/2 = 0.5. But the direction is positive. Wait, maybe the question's "no deviations" is considering the general linear trend. Wait, let's check the other options:
- Option B: exponential relationship. The changes are not multiplicative, so not exponential.
- Option C: negative linear association. The variables are increasing together, so not negative.
- Option D: no relationship. There is a clear trend, so no.
- Option E: positive linear association with one deviation. Wait, but when we look at the first four points, the slope is 0.5/2 = 0.25, and the last point: from 176 (s = 10) to 178 (s = 11), the slope is (11 - 10)/(178 - 176)=0.5. But maybe the question considers that the first four have a consistent increase, and the last one is a deviation? Wait, no, maybe I miscalculated. Wait, let's list the points:
- (170, 8.5), (172, 9), (174, 9.5), (176, 10), (178, 11)
- Let's plot these mentally. The x - values (height) are increasing by 2 each time, and the y - values (shoe size) are increasing: 8.5, 9, 9.5, 10, 11. The differences between consecutive y - values: 0.5, 0.5, 0.5, 1. Wait, but the first four differences are 0.5, and the last is 1. But the overall trend is positive and linear (since the x - values are increasing by a constant amount, and the y - values are increasing, even with a slight deviation in the last step? Wait, no, maybe the question's "no deviations" is because the relationship is generally linear. Wait, maybe the last change is also part of a linear trend? Wait, 8.5 to 9 (0.5), 9 to 9.5 (0.5), 9.5 to 10 (0.5), 10 to 11 (1). Wait, maybe the question considers that the last change is a deviation, but option E says "one deviation", and option A says "no deviations". Wait, maybe I made a mistake. Wait, let's calculate the slope between (170, 8.5) and (172, 9): m=(9 - 8.5)/(172 - 170)=0.5/2 = 0.25. Between (172, 9) and (174, 9.5): m=(9.5 - 9)/(174 - 172)=0.5/2 = 0.25. Between (174, 9.5) and (176, 10): m=(10 - 9.5)/(176 - 174)=0.5/2 = 0.25. Between (176, 10) and (178, 11): m=(11 - 10)/(178 - 176)=1/2 = 0.5. So there is a deviation in t…

Snap & solve any problem in the app
Get step-by-step solutions on Sovi AI
Photo-based solutions with guided steps
Explore more problems and detailed explanations
E. positive linear association with one deviation