QUESTION IMAGE
Question
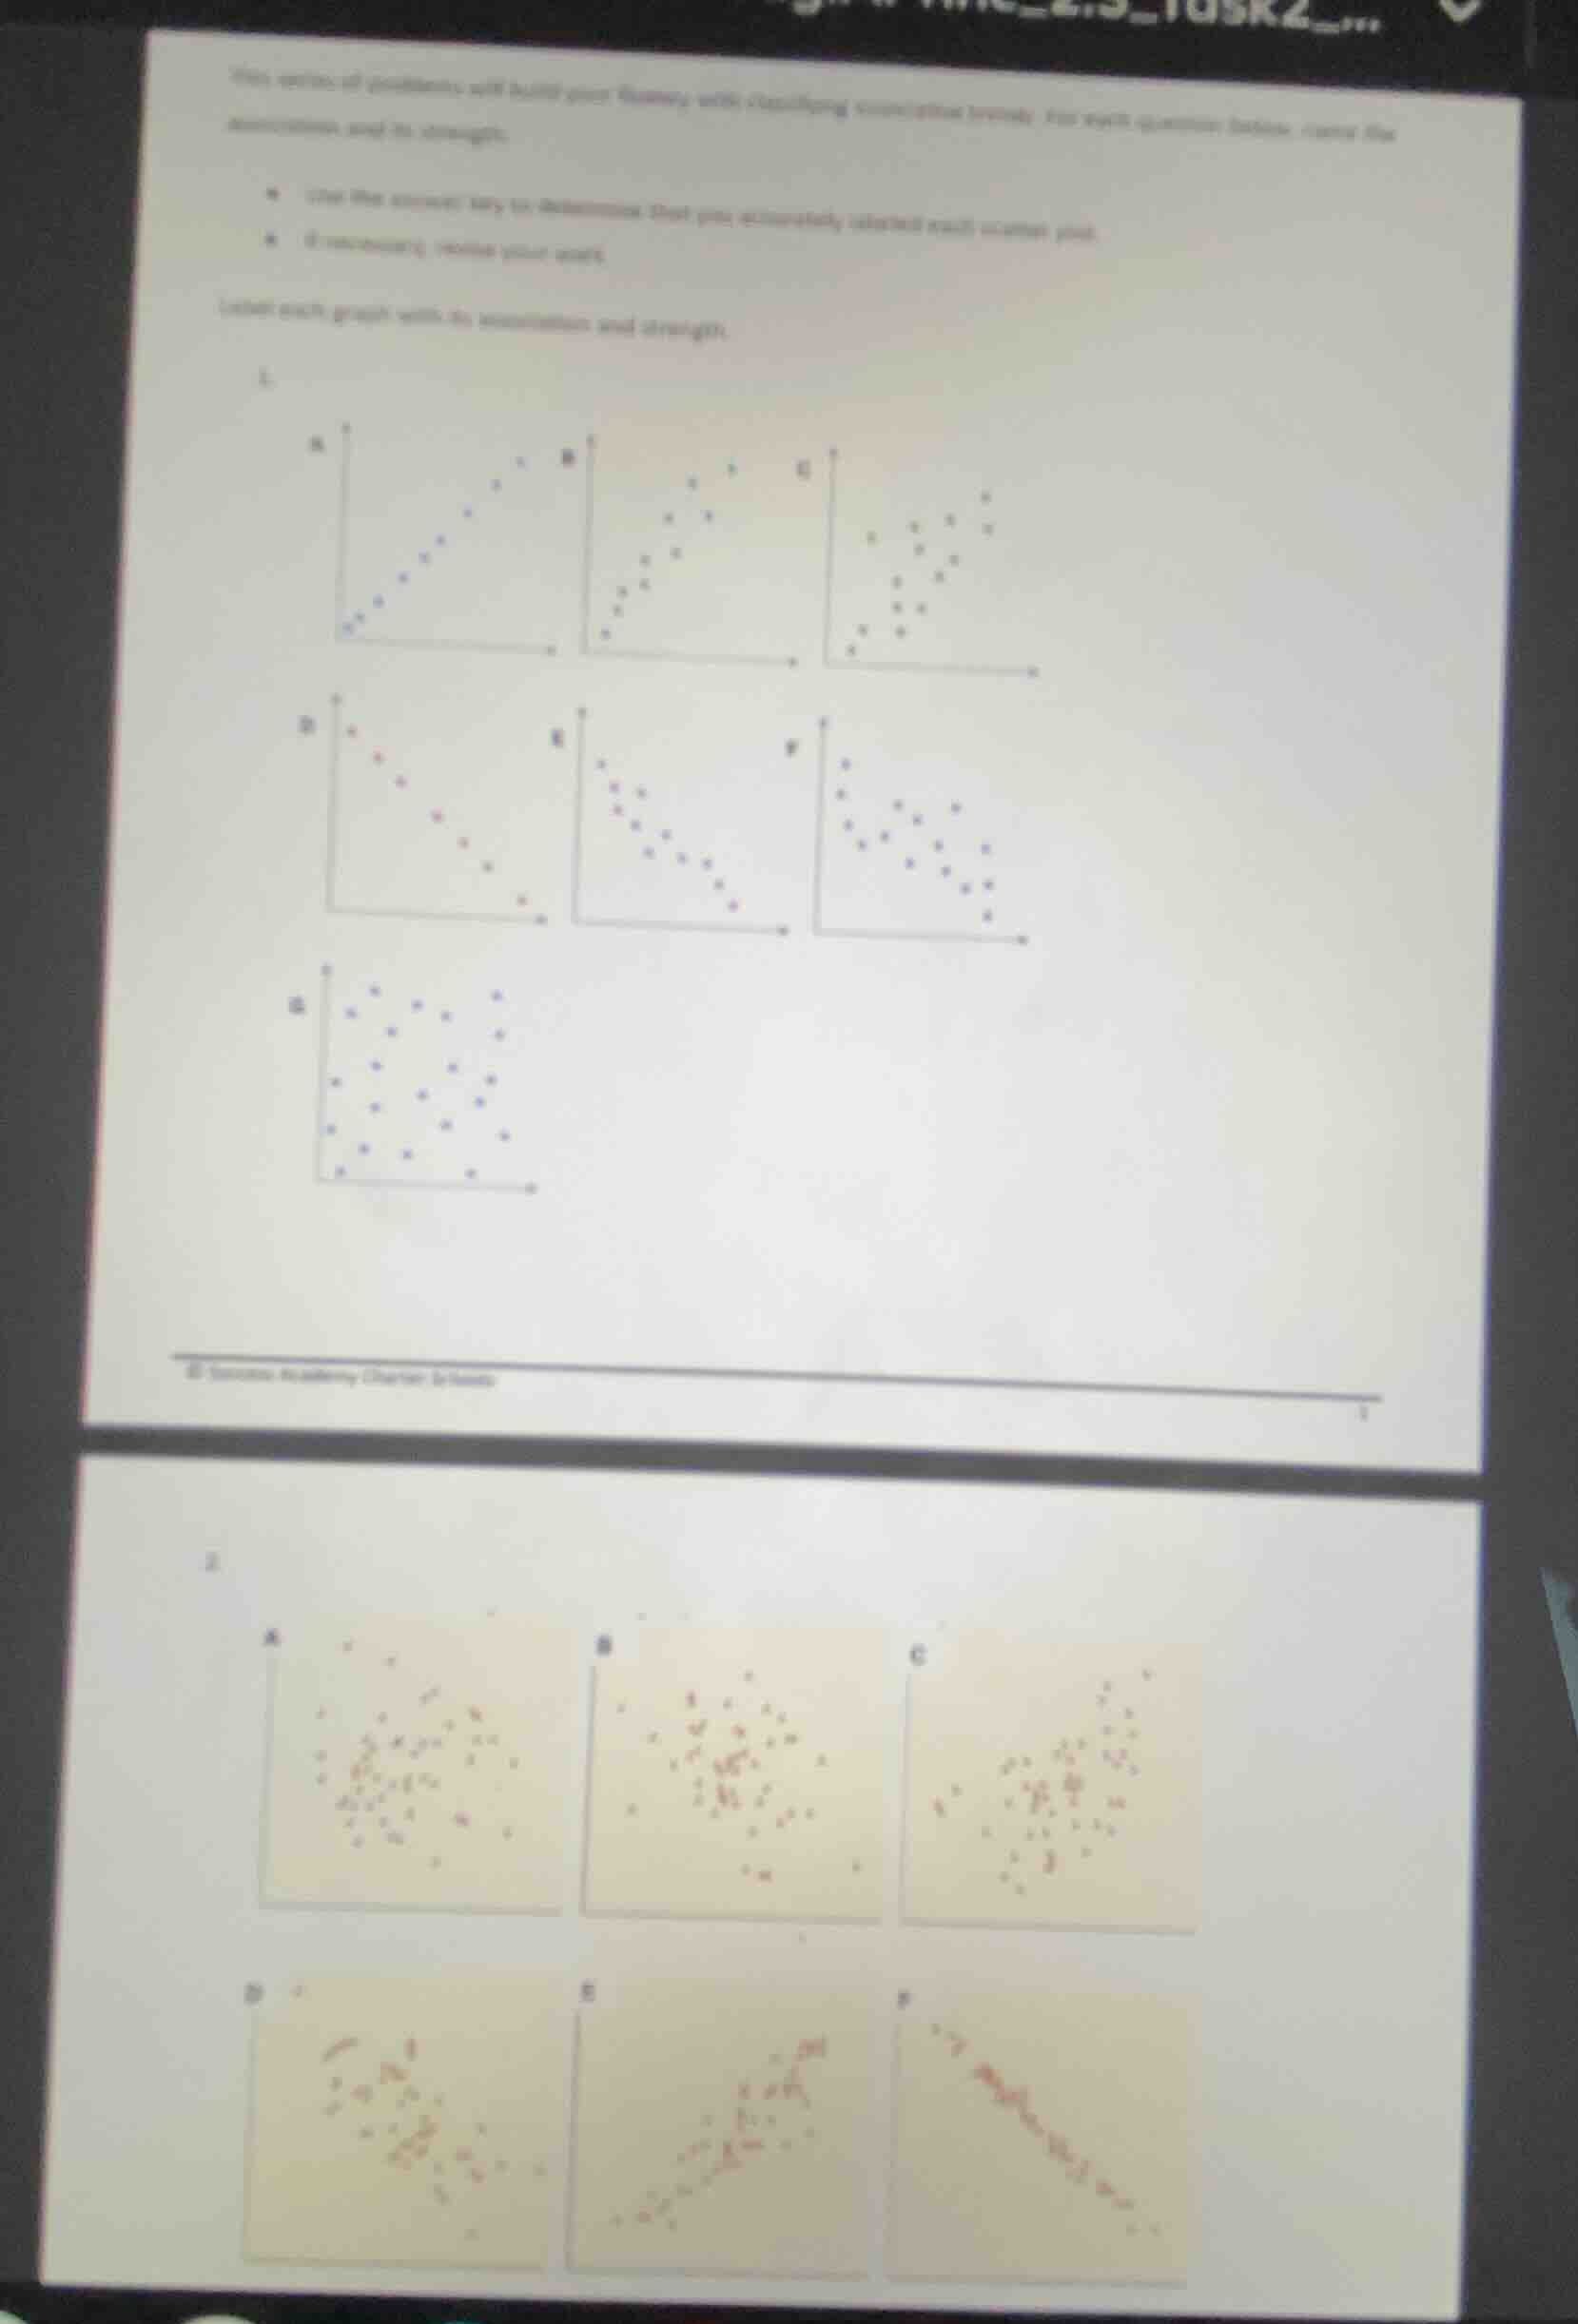
this series of problems will build your fluency with classifying association between two quantities. for each quantity below, name the association and its strength. - use the answer key to determine that pair accurately colored small scatter plot. - if necessary, redoing your work. label each graph with its association and strength. 1. scatter plots a - g 2. scatter plots a - f
To solve this, we analyze each scatter plot for association (positive/negative/no) and strength (strong/moderate/weak):
Problem 1 (First Set of Plots)
Plot A:
- Association: Positive (as \( x \) increases, \( y \) increases).
- Strength: Strong (points lie very close to a straight line).
Plot B:
- Association: Positive (upward trend).
- Strength: Moderate (points follow a trend but with more spread than A).
Plot C:
- Association: Positive (upward trend).
- Strength: Weak (points are somewhat clustered but less tight than B).
Plot D:
- Association: Negative (as \( x \) increases, \( y \) decreases).
- Strength: Weak (points show a trend but are spread out).
Plot E:
- Association: Negative (downward trend).
- Strength: Strong (points lie close to a straight line).
Plot F:
- Association: Negative (downward trend).
- Strength: Moderate (points follow a trend with moderate spread).
Plot G:
- Association: No (points are randomly scattered, no clear trend).
Problem 2 (Second Set of Plots)
Plot A:
- Association: No (random scatter, no trend).
Plot B:
- Association: No (random scatter).
Plot C:
- Association: No (random scatter).
Plot D:
- Association: No (random scatter).
Plot E:
- Association: Positive (upward trend).
- Strength: Weak (points show a slight upward trend with spread).
Plot F:
- Association: Negative (downward trend).
- Strength: Strong (points lie close to a straight line).
Final Labels (Example for Problem 1, Plot A):
- Association: Positive
- Strength: Strong
(Adjust labels based on the specific plot you analyze. For each plot, identify the trend direction (positive/negative/no) and how closely points follow the trend (strong/moderate/weak).)

Snap & solve any problem in the app
Get step-by-step solutions on Sovi AI
Photo-based solutions with guided steps
Explore more problems and detailed explanations
To solve this, we analyze each scatter plot for association (positive/negative/no) and strength (strong/moderate/weak):
Problem 1 (First Set of Plots)
Plot A:
- Association: Positive (as \( x \) increases, \( y \) increases).
- Strength: Strong (points lie very close to a straight line).
Plot B:
- Association: Positive (upward trend).
- Strength: Moderate (points follow a trend but with more spread than A).
Plot C:
- Association: Positive (upward trend).
- Strength: Weak (points are somewhat clustered but less tight than B).
Plot D:
- Association: Negative (as \( x \) increases, \( y \) decreases).
- Strength: Weak (points show a trend but are spread out).
Plot E:
- Association: Negative (downward trend).
- Strength: Strong (points lie close to a straight line).
Plot F:
- Association: Negative (downward trend).
- Strength: Moderate (points follow a trend with moderate spread).
Plot G:
- Association: No (points are randomly scattered, no clear trend).
Problem 2 (Second Set of Plots)
Plot A:
- Association: No (random scatter, no trend).
Plot B:
- Association: No (random scatter).
Plot C:
- Association: No (random scatter).
Plot D:
- Association: No (random scatter).
Plot E:
- Association: Positive (upward trend).
- Strength: Weak (points show a slight upward trend with spread).
Plot F:
- Association: Negative (downward trend).
- Strength: Strong (points lie close to a straight line).
Final Labels (Example for Problem 1, Plot A):
- Association: Positive
- Strength: Strong
(Adjust labels based on the specific plot you analyze. For each plot, identify the trend direction (positive/negative/no) and how closely points follow the trend (strong/moderate/weak).)