QUESTION IMAGE
Question
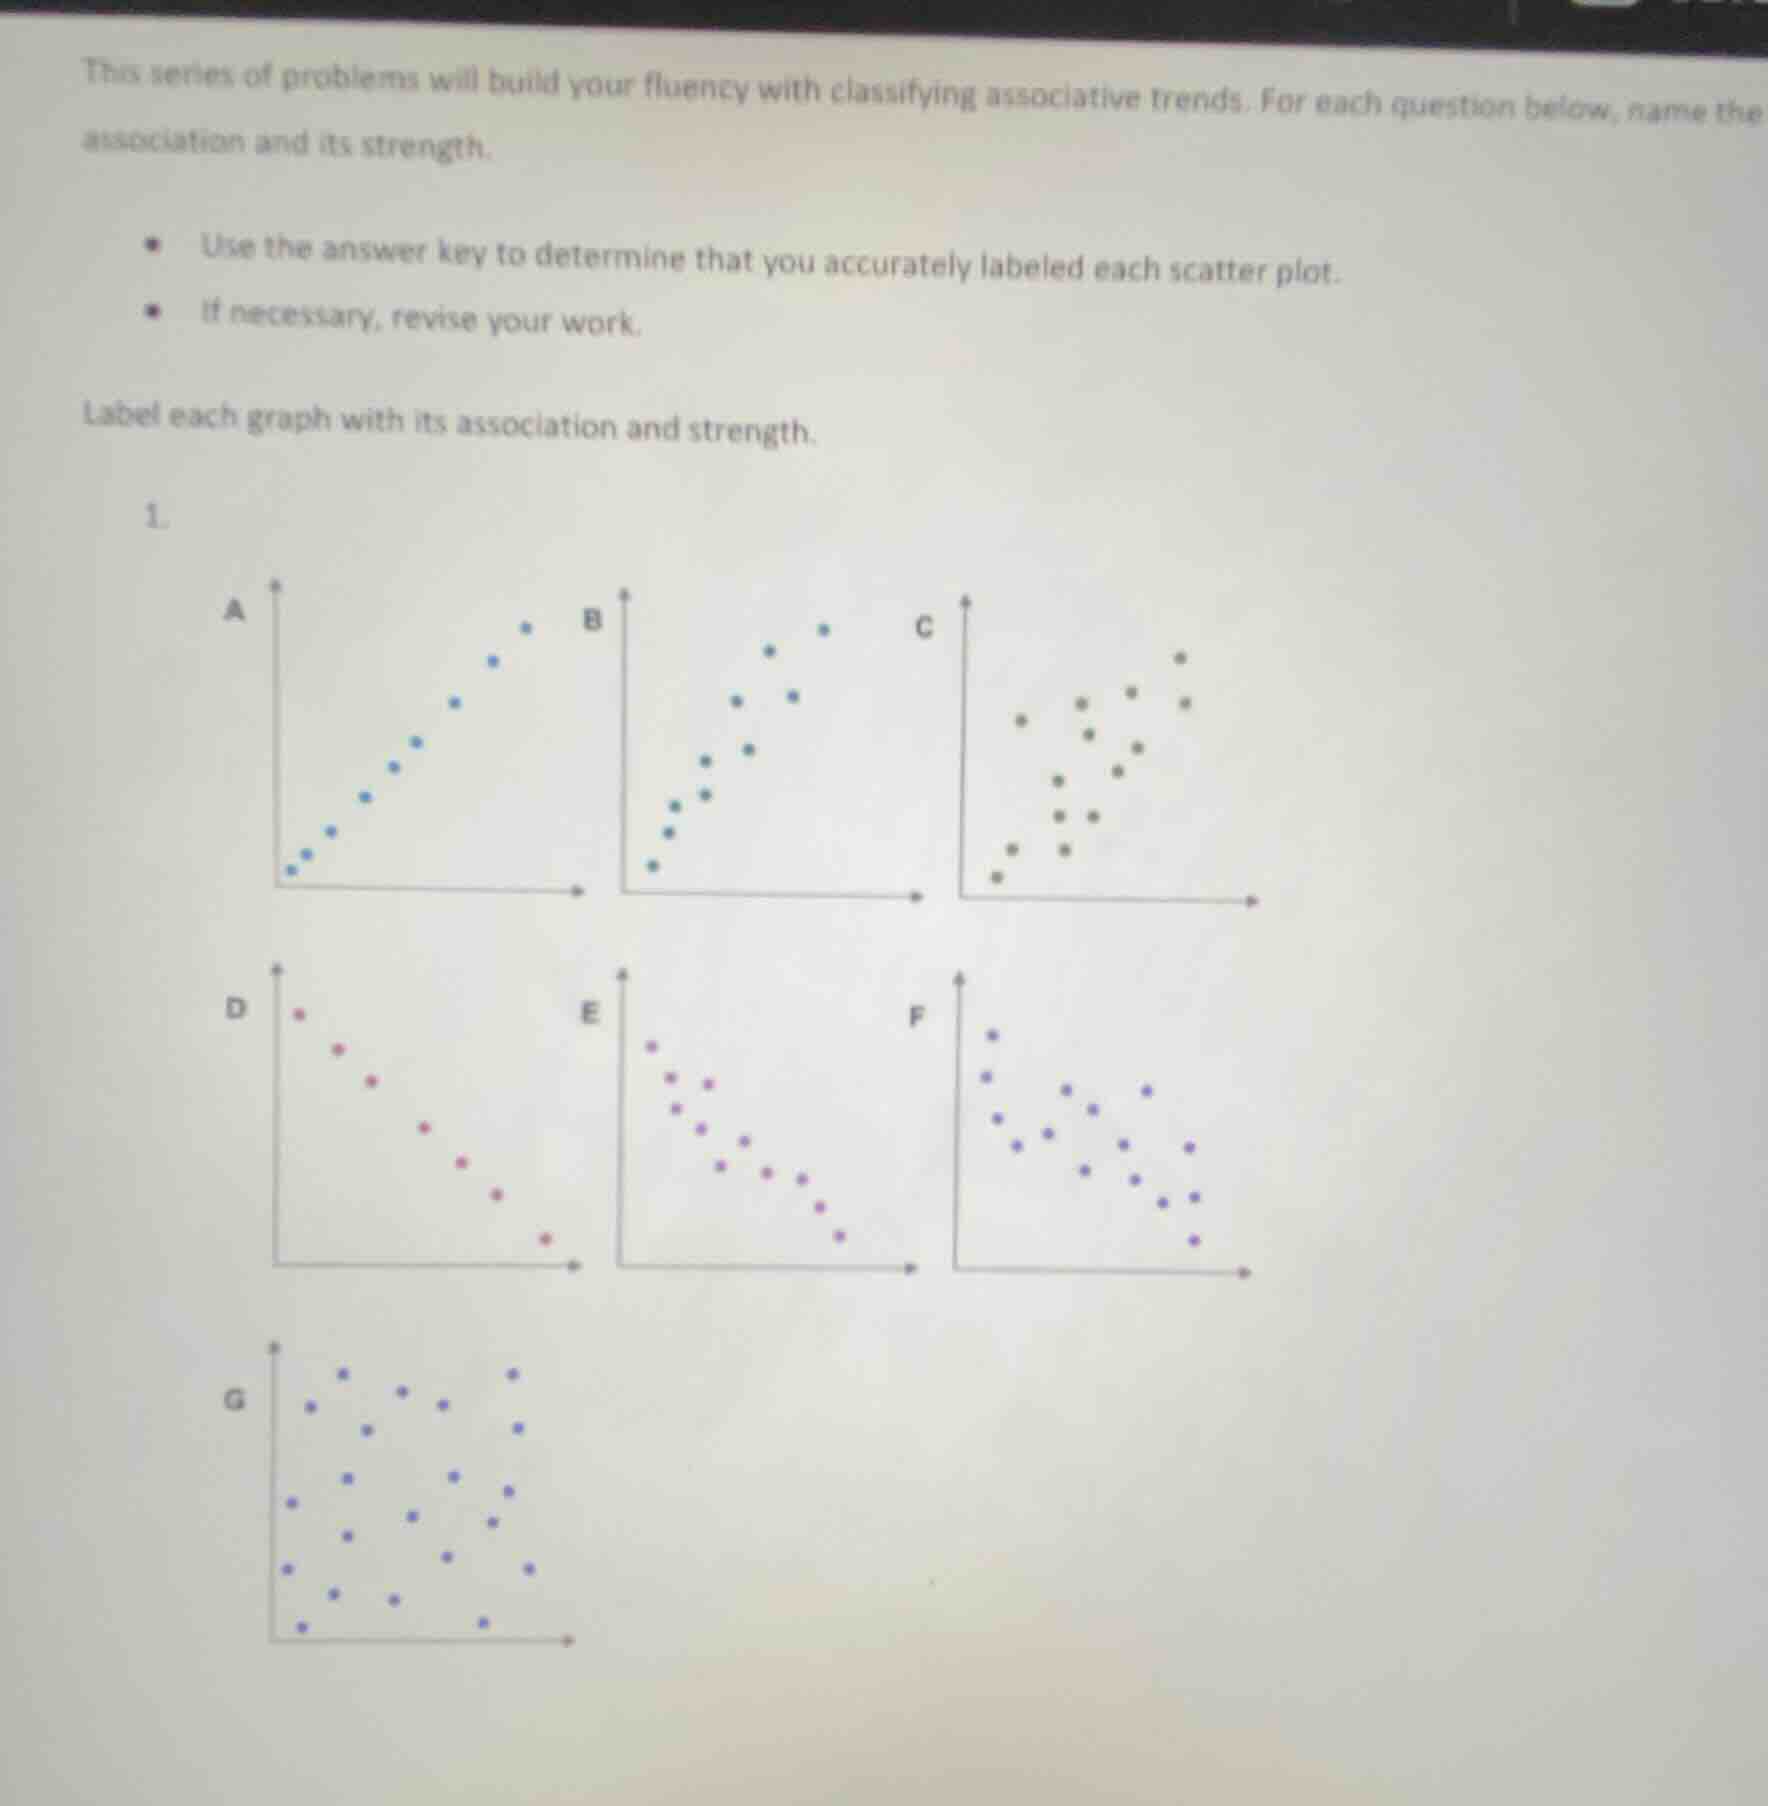
this series of problems will build your fluency with classifying associative trends. for each question below, name the association and its strength.
- use the answer key to determine that you accurately labeled each scatter plot.
- if necessary, revise your work.
label each graph with its association and strength.
1.
scatter plots labeled a, b, c, d, e, f, g are shown, with a, b, d, e, f having apparent linear trends and c, g having more scattered or no clear trends
To solve this, we analyze each scatter plot for direction (positive/negative) and strength (strong/moderate/weak/no association):
Graph A
- Association: Positive (as x increases, y increases).
- Strength: Strong (points lie very close to a straight line).
Graph B
- Association: Positive (x and y increase together).
- Strength: Moderate (points follow a trend but with slight scatter).
Graph C
- Association: Positive (upward trend).
- Strength: Weak (points show a trend but are more scattered).
Graph D
- Association: Negative (as x increases, y decreases).
- Strength: Strong (points lie close to a straight line).
Graph E
- Association: Negative (x increases, y decreases).
- Strength: Moderate (trend is clear but with some scatter).
Graph F
- Association: Negative (downward trend).
- Strength: Weak (points are scattered but show a trend).
Graph G
- Association: No association (points are randomly scattered, no clear trend).
- Strength: No association (or "weak" in the context of no trend).
Final Answers (per graph):
- A: Positive, Strong
- B: Positive, Moderate
- C: Positive, Weak
- D: Negative, Strong
- E: Negative, Moderate
- F: Negative, Weak
- G: No Association, No Strength (or "Weak" for no trend)

Snap & solve any problem in the app
Get step-by-step solutions on Sovi AI
Photo-based solutions with guided steps
Explore more problems and detailed explanations
To solve this, we analyze each scatter plot for direction (positive/negative) and strength (strong/moderate/weak/no association):
Graph A
- Association: Positive (as x increases, y increases).
- Strength: Strong (points lie very close to a straight line).
Graph B
- Association: Positive (x and y increase together).
- Strength: Moderate (points follow a trend but with slight scatter).
Graph C
- Association: Positive (upward trend).
- Strength: Weak (points show a trend but are more scattered).
Graph D
- Association: Negative (as x increases, y decreases).
- Strength: Strong (points lie close to a straight line).
Graph E
- Association: Negative (x increases, y decreases).
- Strength: Moderate (trend is clear but with some scatter).
Graph F
- Association: Negative (downward trend).
- Strength: Weak (points are scattered but show a trend).
Graph G
- Association: No association (points are randomly scattered, no clear trend).
- Strength: No association (or "weak" in the context of no trend).
Final Answers (per graph):
- A: Positive, Strong
- B: Positive, Moderate
- C: Positive, Weak
- D: Negative, Strong
- E: Negative, Moderate
- F: Negative, Weak
- G: No Association, No Strength (or "Weak" for no trend)