QUESTION IMAGE
Question
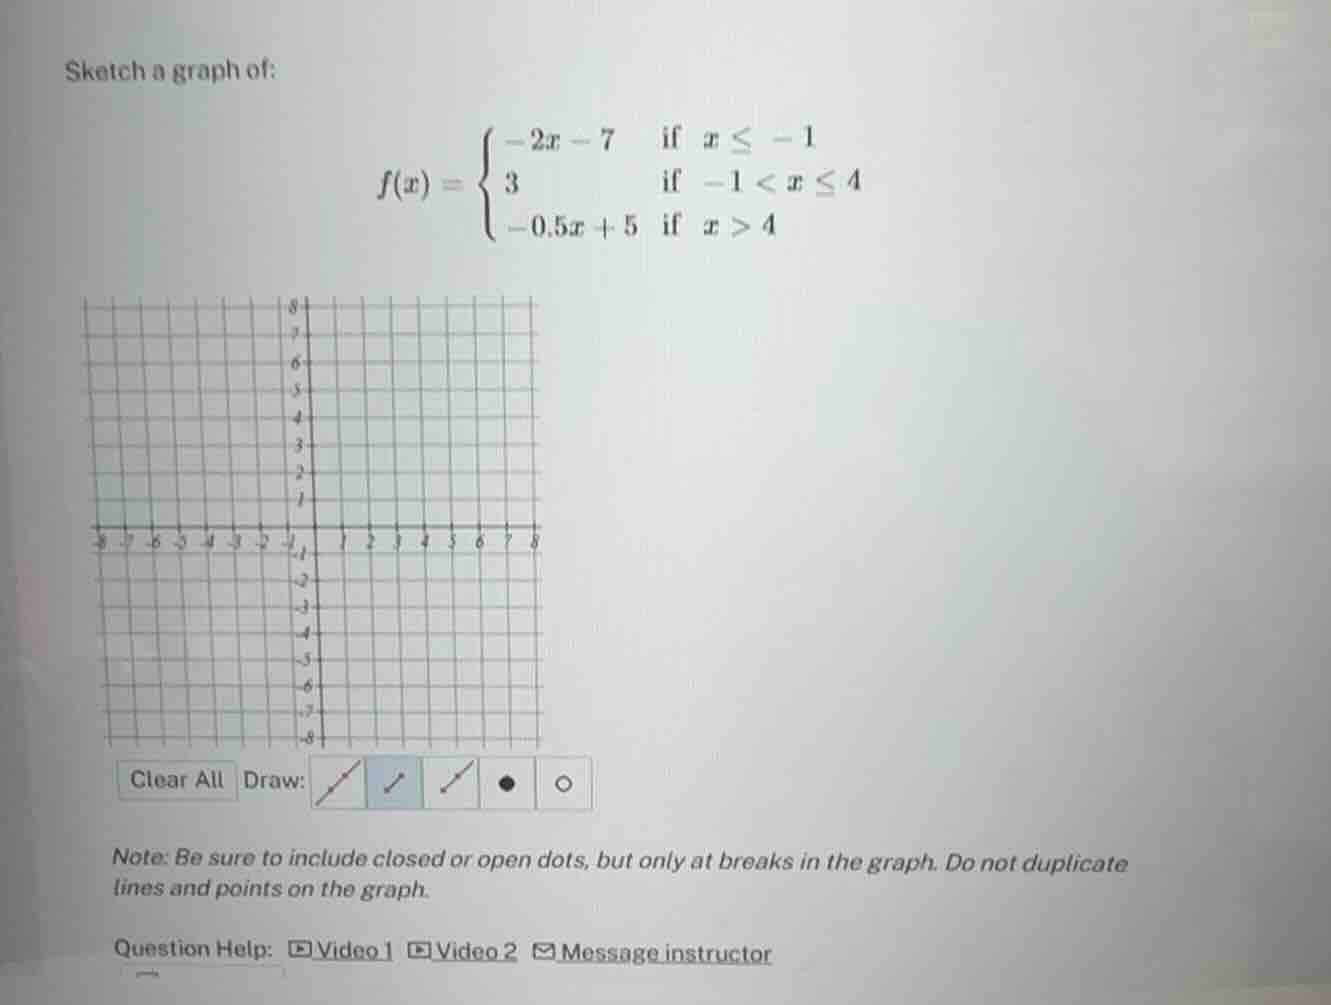
sketch a graph of:
$f(x) = \
$
note: be sure to include closed or open dots, but only at breaks in the graph. do not duplicate lines and points on the graph.
question help: video 1 video 2 message instructor
Step1: Analyze the first piece ($x \leq -1$)
The function is $f(x) = -2x - 7$ for $x \leq -1$. This is a linear function. Let's find two points. When $x = -1$, $f(-1) = -2(-1) - 7 = 2 - 7 = -5$. Since $x \leq -1$, the point at $x = -1$ is a closed dot. Let's take another point, say $x = -3$: $f(-3) = -2(-3) - 7 = 6 - 7 = -1$. So we have points $(-3, -1)$ and $(-1, -5)$ (closed dot) for this segment.
Step2: Analyze the second piece ($-1 < x \leq 4$)
The function is $f(x) = 3$ for $-1 < x \leq 4$. This is a horizontal line. At $x = -1$, it's an open dot (since $x > -1$) with $y = 3$, and at $x = 4$, it's a closed dot with $y = 3$. So this is a horizontal line segment from $(-1, 3)$ (open dot) to $(4, 3)$ (closed dot).
Step3: Analyze the third piece ($x > 4$)
The function is $f(x) = -0.5x + 5$ for $x > 4$. This is a linear function. At $x = 4$, it's an open dot: $f(4) = -0.5(4) + 5 = -2 + 5 = 3$ (but since $x > 4$, it's open). Let's take another point, say $x = 6$: $f(6) = -0.5(6) + 5 = -3 + 5 = 2$. So we have an open dot at $(4, 3)$ and a point $(6, 2)$ for this segment.
Step4: Sketching the graph
- For the first segment ($x \leq -1$), plot the closed dot at $(-1, -5)$ and the line through $(-3, -1)$ and $(-1, -5)$.
- For the second segment ($-1 < x \leq 4$), draw a horizontal line from the open dot at $(-1, 3)$ to the closed dot at $(4, 3)$.
- For the third segment ($x > 4$), plot the open dot at $(4, 3)$ and the line through $(4, 3)$ (open) and $(6, 2)$.
(Note: Since the problem asks to sketch, the above steps describe how to plot the points and segments. The actual graph would have these three parts connected appropriately with the correct dot types.)

Snap & solve any problem in the app
Get step-by-step solutions on Sovi AI
Photo-based solutions with guided steps
Explore more problems and detailed explanations
To sketch the graph:
- First segment ($\boldsymbol{x \leq -1}$): Plot a closed dot at $(-1, -5)$ and draw the line $y = -2x - 7$ for $x \leq -1$ (e.g., through $(-3, -1)$ and $(-1, -5)$).
- Second segment ($\boldsymbol{-1 < x \leq 4}$): Draw a horizontal line with an open dot at $(-1, 3)$ and a closed dot at $(4, 3)$ (height $y = 3$).
- Third segment ($\boldsymbol{x > 4}$): Plot an open dot at $(4, 3)$ and draw the line $y = -0.5x + 5$ for $x > 4$ (e.g., through $(4, 3)$ (open) and $(6, 2)$).
(The final graph will have these three connected segments with correct open/closed dots.)