QUESTION IMAGE
Question
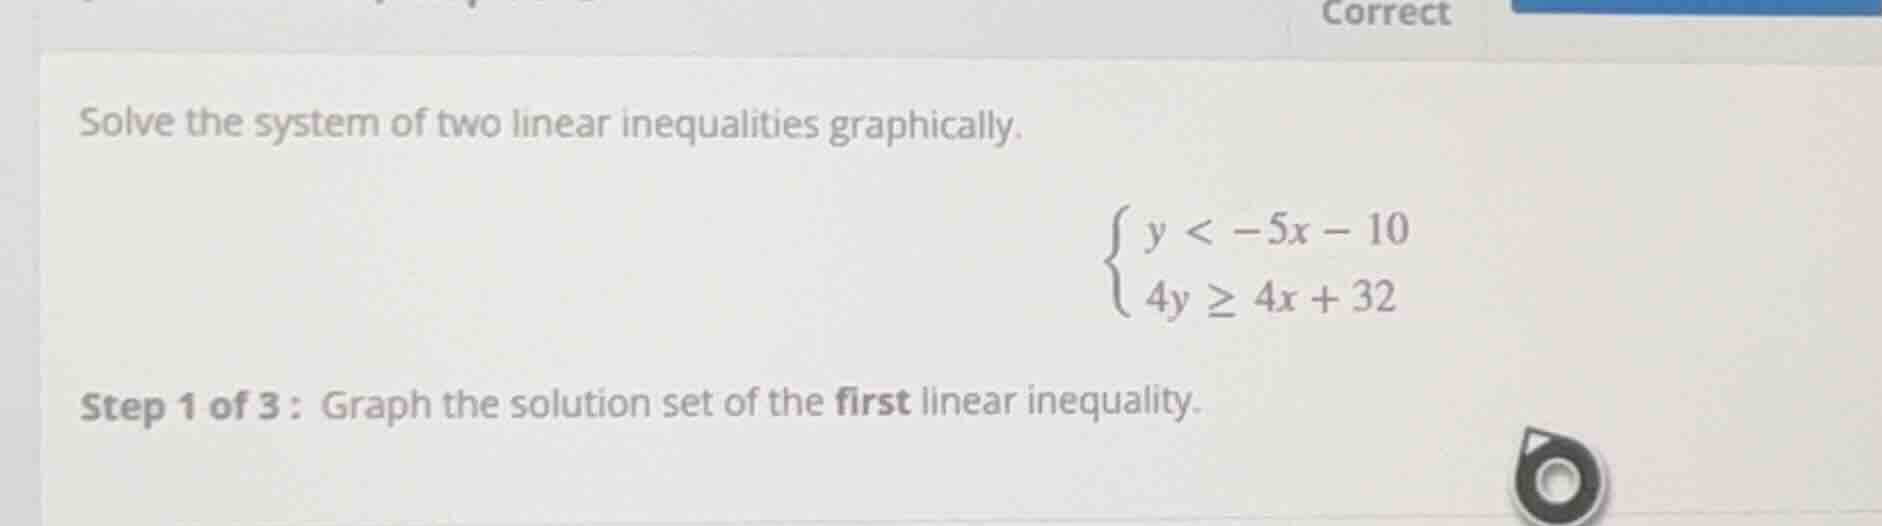
solve the system of two linear inequalities graphically.\
\
step 1 of 3 : graph the solution set of the first linear inequality.
Step1: Identify boundary line
The first inequality is $y < -5x - 10$. Its boundary is the line $y = -5x - 10$. Since the inequality uses $<$, the line is dashed.
Step2: Find intercepts for plotting
- x-intercept: Set $y=0$:
$0 = -5x - 10$
$5x = -10$
$x = -2$
So the x-intercept is $(-2, 0)$.
- y-intercept: Set $x=0$:
$y = -5(0) - 10 = -10$
So the y-intercept is $(0, -10)$.
Step3: Determine shaded region
Test the origin $(0,0)$ in $y < -5x -10$:
$0 < -5(0) -10$ → $0 < -10$, which is false. Shade the region not containing the origin (below the dashed line).

Snap & solve any problem in the app
Get step-by-step solutions on Sovi AI
Photo-based solutions with guided steps
Explore more problems and detailed explanations
Graph a dashed line passing through $(-2, 0)$ and $(0, -10)$, then shade the region below this line.