QUESTION IMAGE
Question
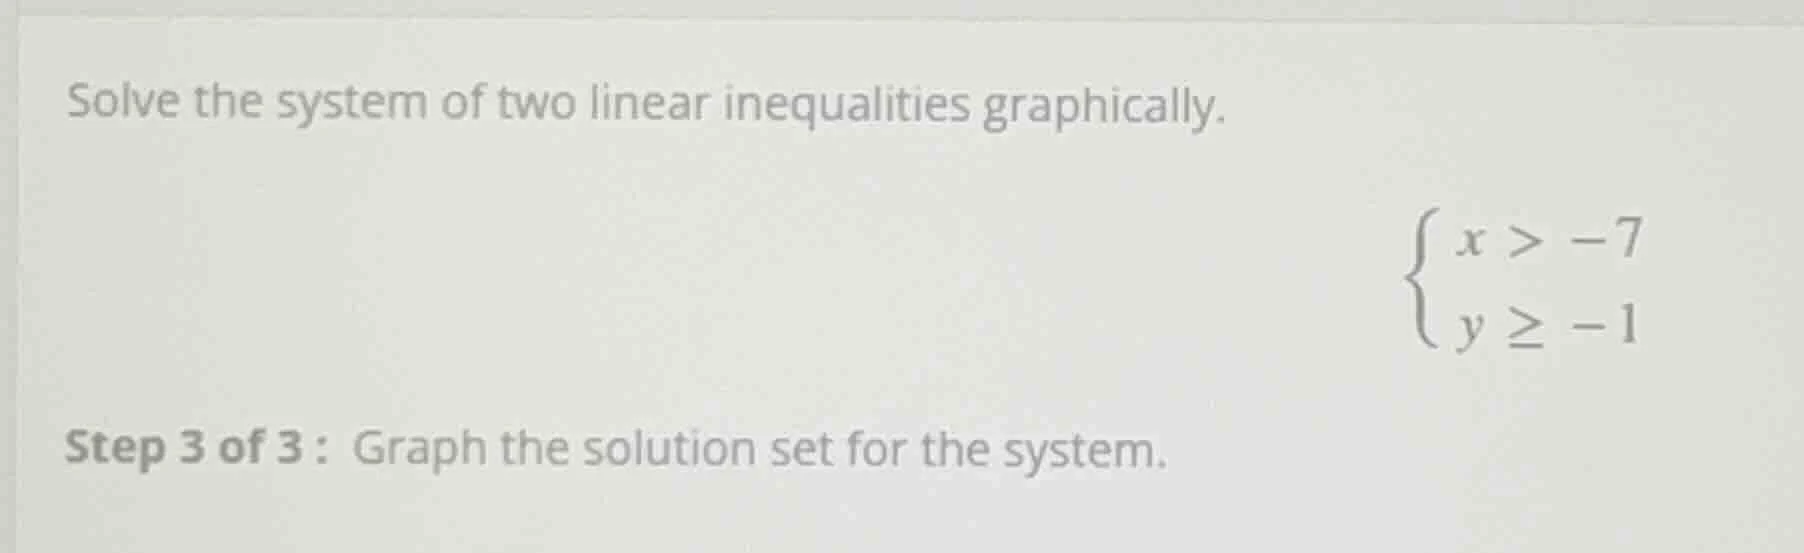
solve the system of two linear inequalities graphically.
\
step 3 of 3 : graph the solution set for the system.
Step1: Graph boundary $x=-7$
Draw a dashed vertical line at $x=-7$ (dashed because $x>-7$ does not include equality). Shade the region to the right of this line, since $x$ values greater than $-7$ lie here.
Step2: Graph boundary $y=-1$
Draw a solid horizontal line at $y=-1$ (solid because $y\geq-1$ includes equality). Shade the region above this line, since $y$ values greater than or equal to $-1$ lie here.
Step3: Identify overlapping shaded region
The solution set is the intersection of the two shaded regions: the area to the right of $x=-7$ and above or on $y=-1$.

Snap & solve any problem in the app
Get step-by-step solutions on Sovi AI
Photo-based solutions with guided steps
Explore more problems and detailed explanations
The solution set is the region bounded by the dashed vertical line $x=-7$ (right side) and solid horizontal line $y=-1$ (above/on the line), where the two shaded areas overlap.
- Dashed line: $x=-7$, shade right
- Solid line: $y=-1$, shade above
- Overlap is the final solution region