QUESTION IMAGE
Question
solving systems of linear inequalities
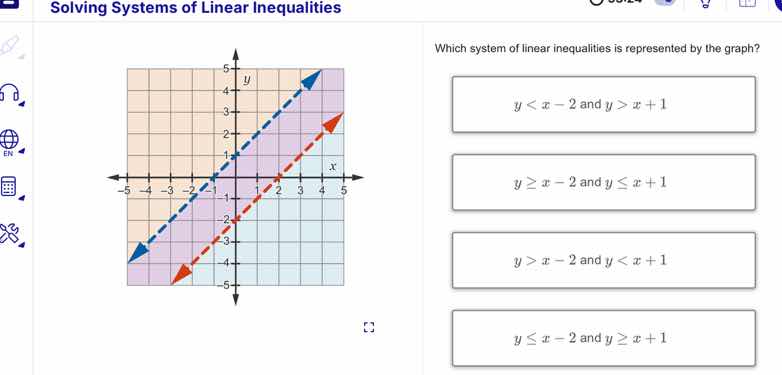
which system of linear inequalities is represented by the graph?
$y < x - 2$ and $y > x + 1$
$y \geq x - 2$ and $y \leq x + 1$
$y > x - 2$ and $y < x + 1$
$y \leq x - 2$ and $y \geq x + 1$
Step1: Analyze the blue line (dashed)
The blue line has a slope of 1 and y - intercept - 2, so its equation is \(y = x - 2\). Since the line is dashed, the inequality is strict (\(>\) or \(<\)). The shaded region above the blue line means \(y>x - 2\).
Step2: Analyze the red line (dashed)
The red line has a slope of 1 and y - intercept 1, so its equation is \(y=x + 1\). Since the line is dashed, the inequality is strict (\(>\) or \(<\)). The shaded region below the red line means \(y The system \(y>x - 2\) and \(yStep3: Match with options

Snap & solve any problem in the app
Get step-by-step solutions on Sovi AI
Photo-based solutions with guided steps
Explore more problems and detailed explanations
\(y > x - 2\) and \(y < x + 1\) (the third option in the list)