QUESTION IMAGE
Question
svlc algebra 1a - standard (15260)
introduction to compound inequalities
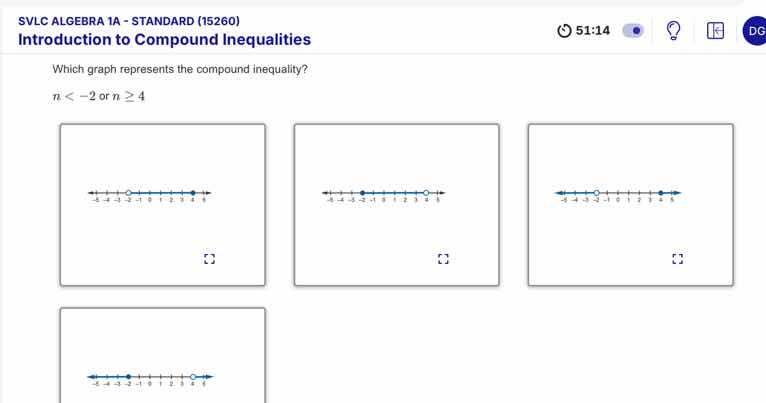
which graph represents the compound inequality?
n < -2 or n ≥ 4
Step1: Analyze \( n < -2 \)
For \( n < -2 \), the graph should have an open circle at \(-2\) (since \( n \) is not equal to \(-2\)) and an arrow pointing to the left (for values less than \(-2\)).
Step2: Analyze \( n \geq 4 \)
For \( n \geq 4 \), the graph should have a closed circle at \( 4 \) (since \( n \) can be equal to \( 4 \)) and an arrow pointing to the right (for values greater than or equal to \( 4 \)).
Step3: Match the Graph
We need to find the graph that has an open circle at \(-2\) with a left - pointing arrow and a closed circle at \( 4 \) with a right - pointing arrow. Looking at the options, the third graph (the one with the open circle at \(-2\) and closed circle at \( 4 \) with the appropriate arrows) is the correct one.

Snap & solve any problem in the app
Get step-by-step solutions on Sovi AI
Photo-based solutions with guided steps
Explore more problems and detailed explanations
The third graph (the one with open circle at - 2, closed circle at 4, left - arrow from - 2, right - arrow from 4)