QUESTION IMAGE
Question
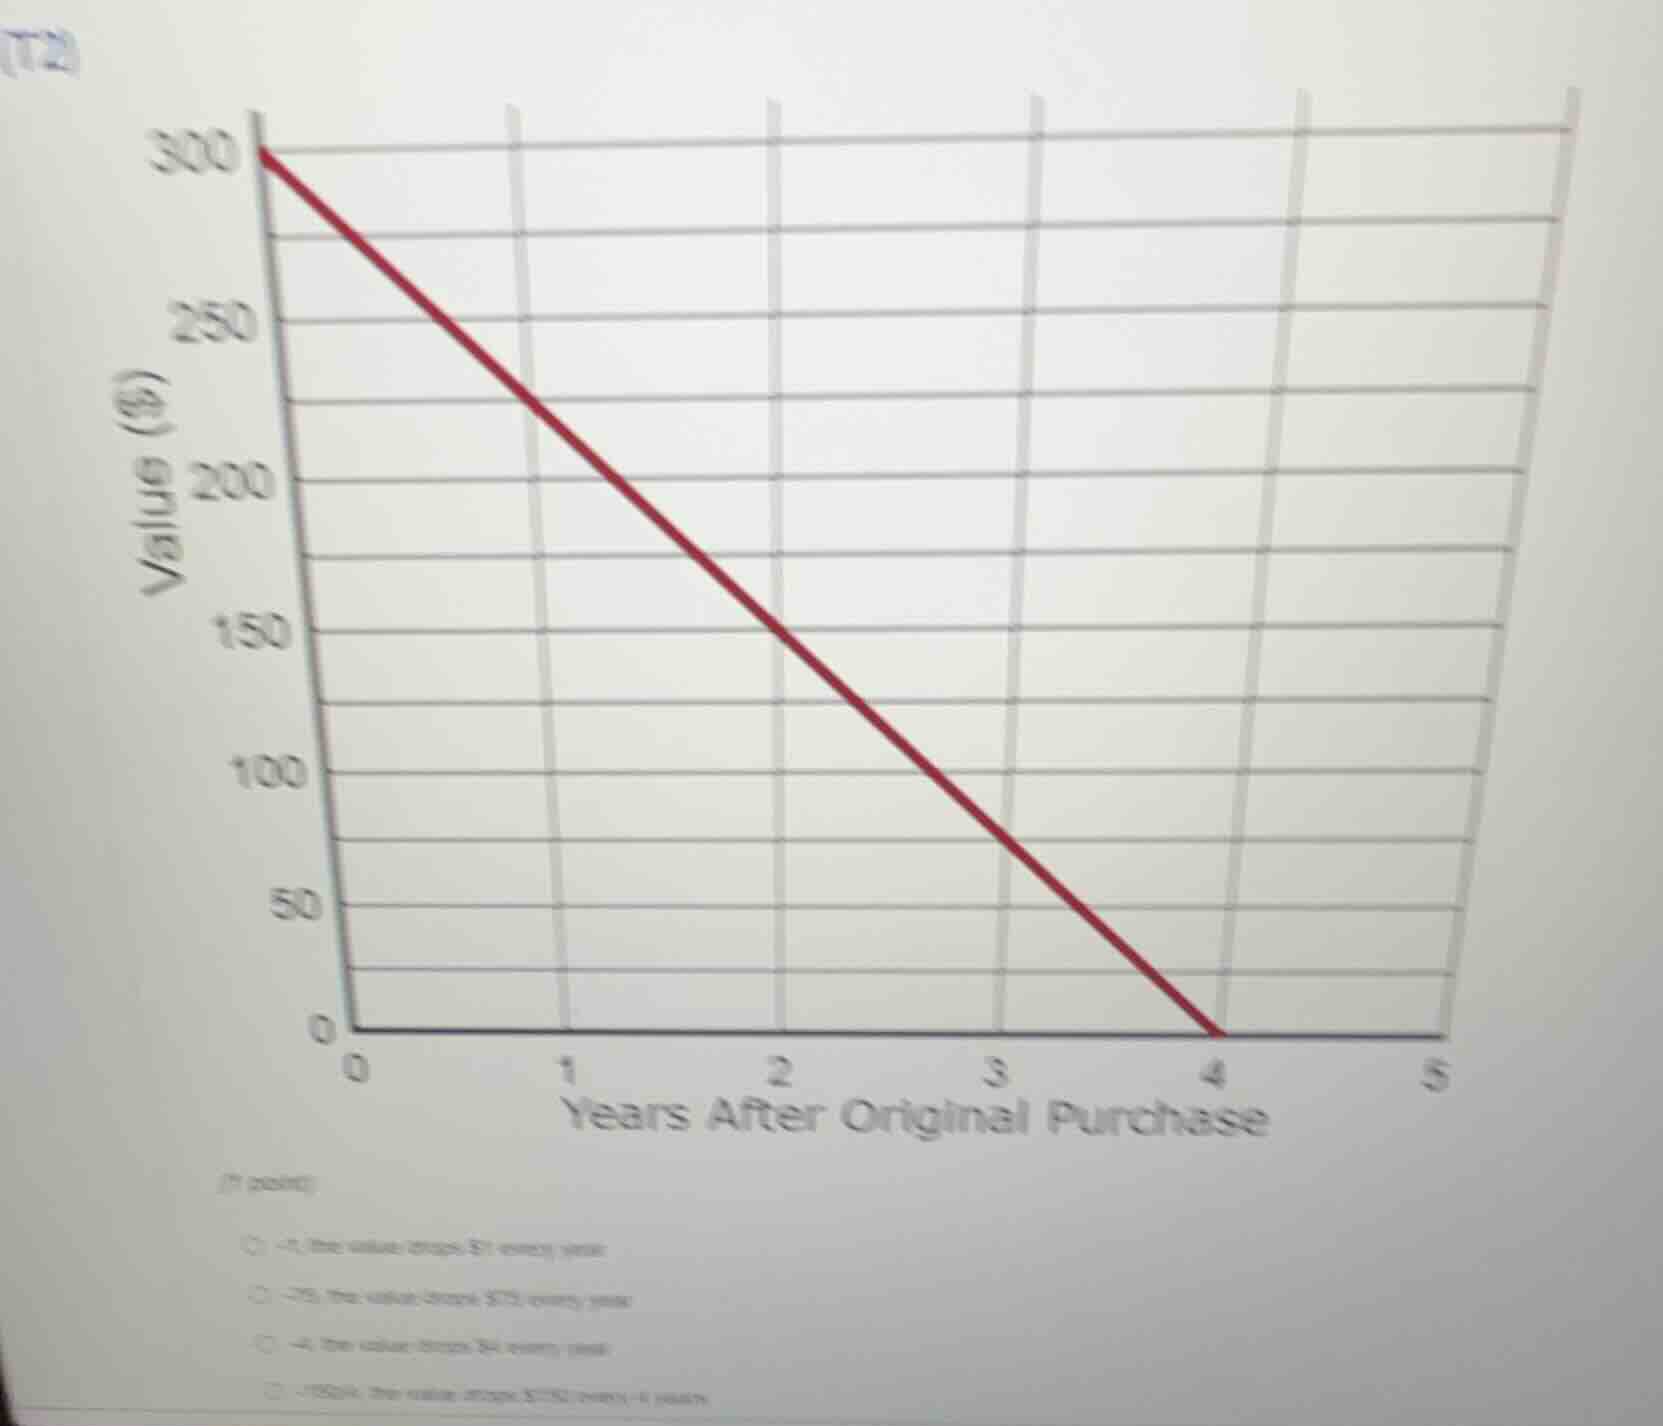
(t2) (7 points) which of the following represents the slope of the line in the graph and what does it mean? choose the correct option: -1; the value drops $1 every year -75; the value drops $75 every year -4; the value drops $4 every year -150/2; the value drops $150 every 2 years
Step1: Identify two points
From the graph, when \( x = 0 \) (years after purchase), \( y = 300 \) (value in dollars). When \( x = 4 \), \( y = 0 \).
Step2: Calculate the slope
The slope \( m \) of a line is given by \( m=\frac{y_2 - y_1}{x_2 - x_1} \). Substituting \( (x_1,y_1)=(0,300) \) and \( (x_2,y_2)=(4,0) \), we get \( m=\frac{0 - 300}{4 - 0}=\frac{- 300}{4}=-75 \). The slope represents the rate of change of value per year, so the value drops $75 every year.

Snap & solve any problem in the app
Get step-by-step solutions on Sovi AI
Photo-based solutions with guided steps
Explore more problems and detailed explanations
-75; the value drops $75 every year