QUESTION IMAGE
Question
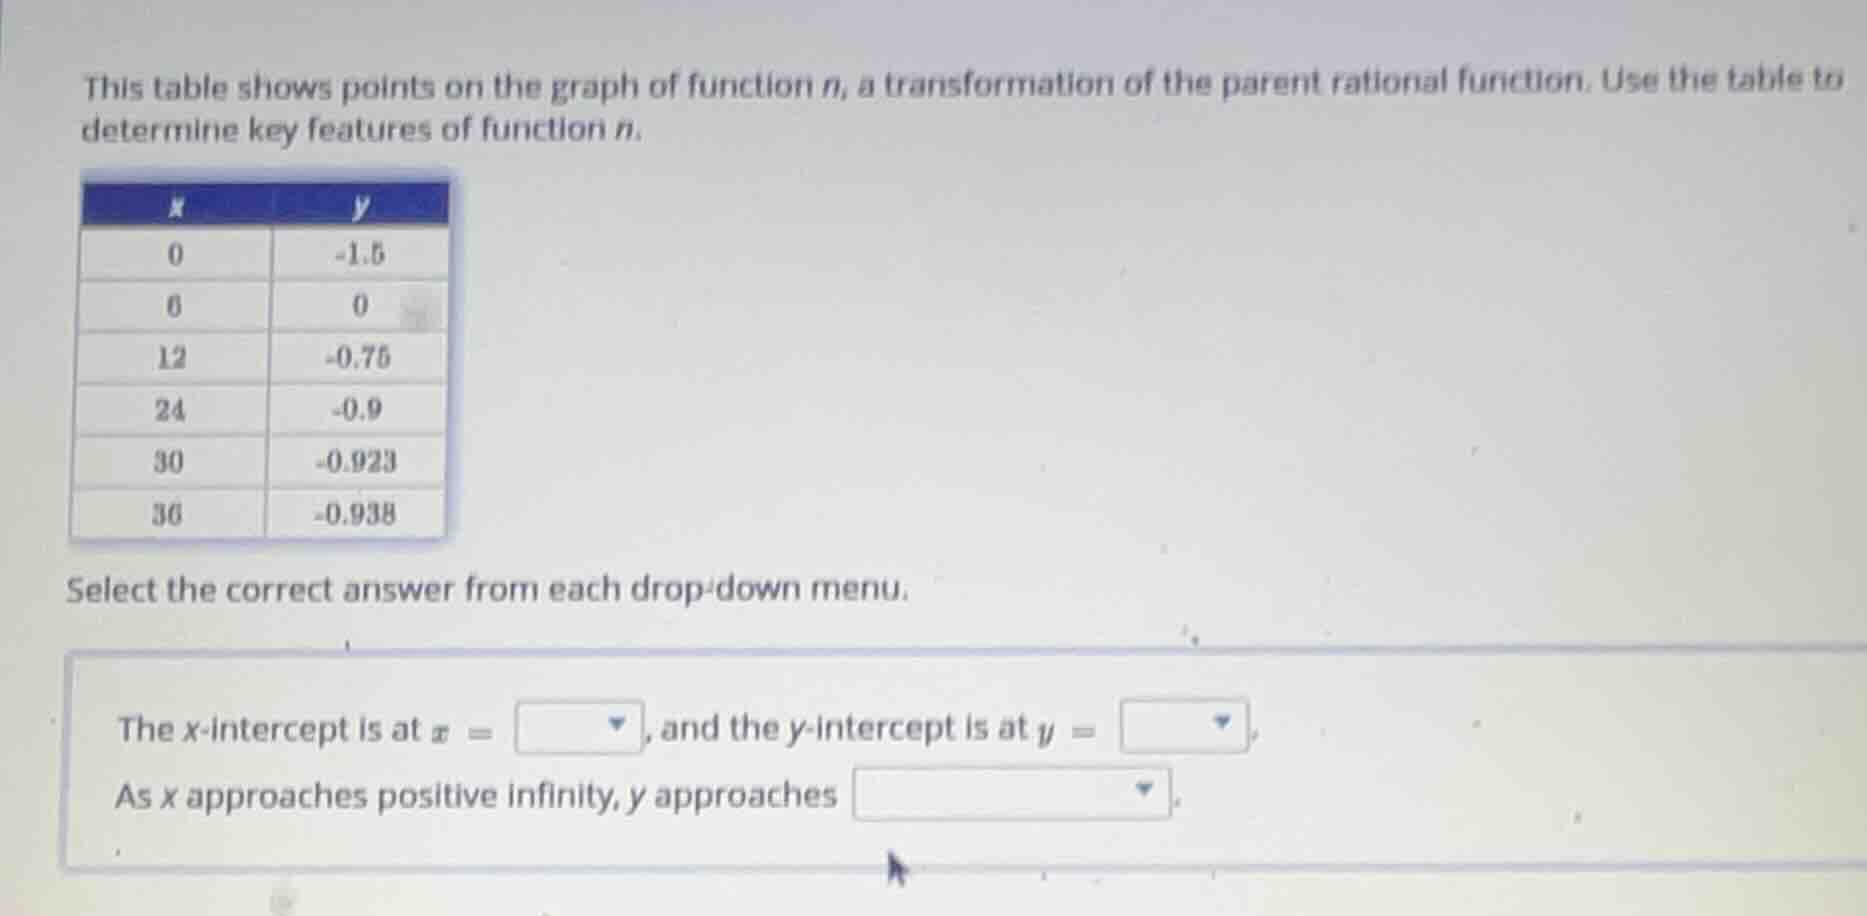
this table shows points on the graph of function n, a transformation of the parent rational function. use the table to determine key features of function n.
(table with x and y values: x=0,y=-1.5; x=6,y=0; x=12,y=-0.75; x=24,y=-0.9; x=30,y=-0.923; x=36,y=-0.938)
select the correct answer from each drop - down menu.
the x - intercept is at x = dropdown, and the y - intercept is at y = dropdown.
as x approaches positive infinity, y approaches dropdown.
Step1: Find x-intercept (y=0)
Look for row where $y=0$: $x=6$
Step2: Find y-intercept (x=0)
Look for row where $x=0$: $y=-1.5$
Step3: Analyze end behavior
As $x$ increases, $y$ approaches $-1$ (values get closer to -1: -0.75, -0.9, -0.923, -0.938)

Snap & solve any problem in the app
Get step-by-step solutions on Sovi AI
Photo-based solutions with guided steps
Explore more problems and detailed explanations
The x-intercept is at $x = 6$, and the y-intercept is at $y = -1.5$
As $x$ approaches positive infinity, $y$ approaches $-1$