QUESTION IMAGE
Question
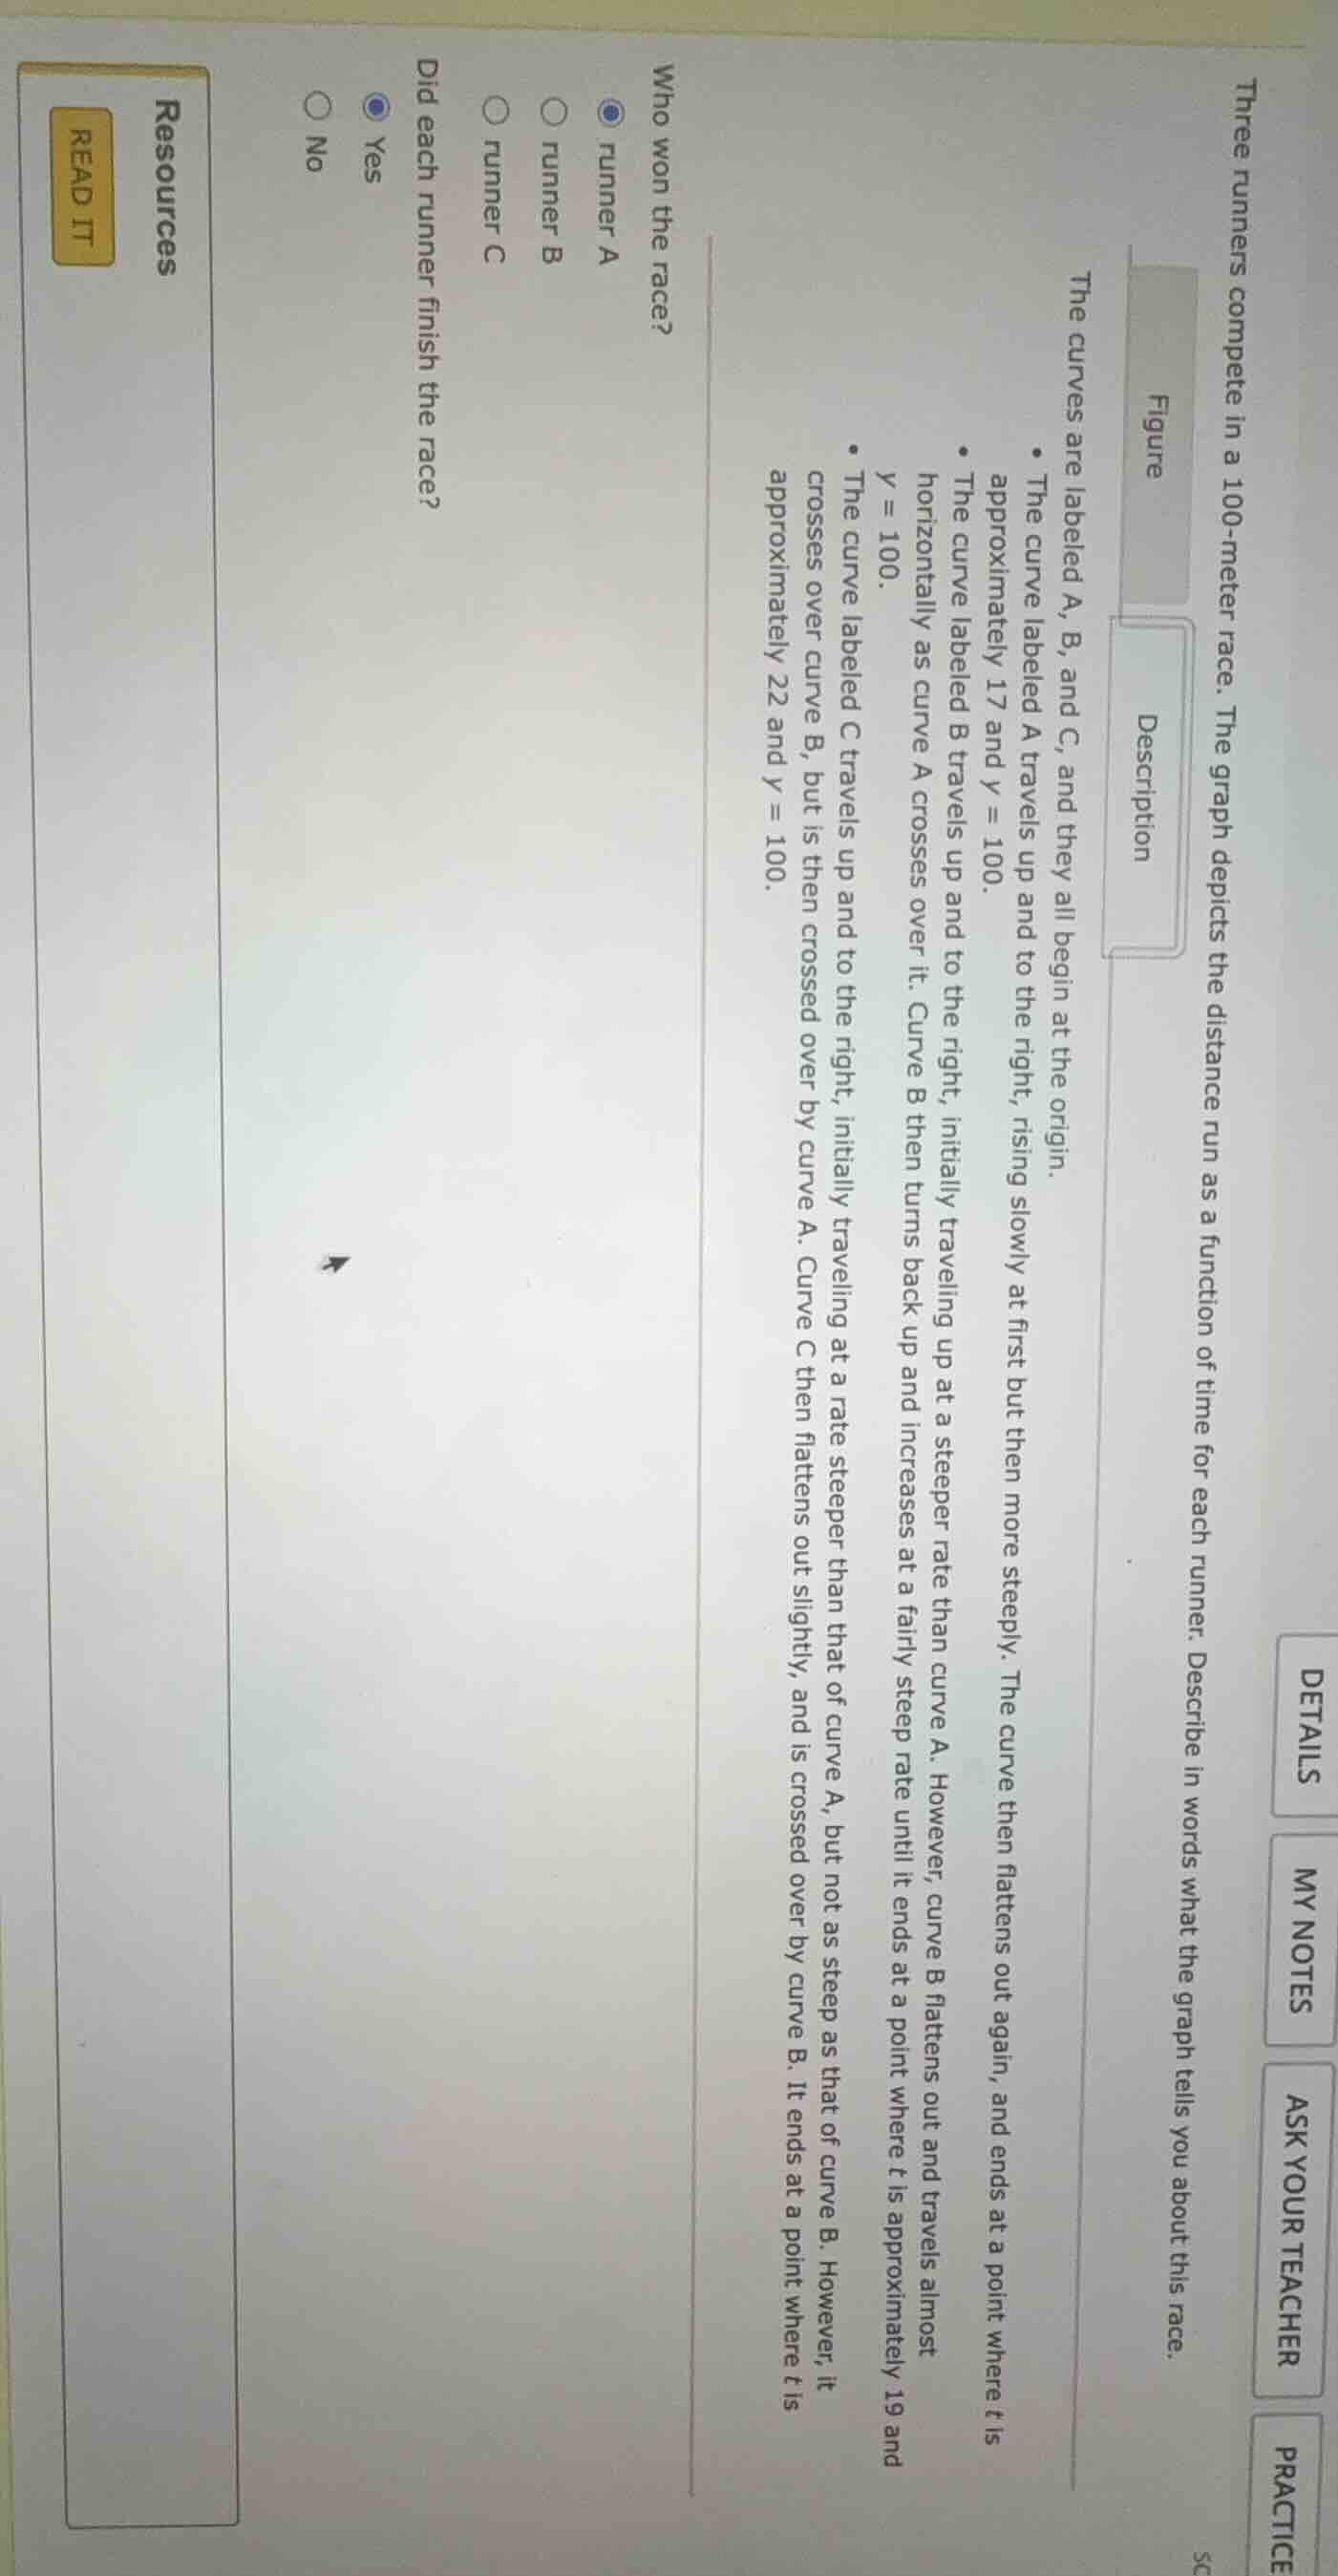
three runners compete in a 100 - meter race. the graph depicts the distance run as a function of time for each runner. describe in words what the graph tells you about this race.
figure
description
the curves are labeled a, b, and c, and they all begin at the origin.
- the curve labeled a travels up and to the right, rising slowly at first but then more steeply. the curve then flattens out again, and ends at a point where t is approximately 17 and y = 100.
- the curve labeled b travels up and to the right, initially traveling at a steeper rate than curve a. however, curve b flattens out and travels almost horizontally as curve a crosses over it. curve b then turns back up and increases at a fairly steep rate until it ends at a point where t is approximately 19 and y = 100.
- the curve labeled c travels up and to the right, initially traveling at a rate steeper than that of curve a, but not as steep as that of curve b. however, it crosses over curve b, but is then crossed over by curve a. curve c then flattens out slightly, and is crossed over by curve b. it ends at a point where t is approximately 22 and y = 100.
who won the race?
○ runner a
○ runner b
○ runner c
did each runner finish the race?
● yes
○ no
Brief Explanations
- For the race winner: The runner who reaches $y=100$ meters in the smallest time $t$ wins. Runner A finishes at $t\approx17$, which is earlier than Runner B ($t\approx19$) and Runner C ($t\approx22$).
- For finishing the race: All three curves end at $y=100$, meaning each runner completed the 100-meter distance.

Snap & solve any problem in the app
Get step-by-step solutions on Sovi AI
Photo-based solutions with guided steps
Explore more problems and detailed explanations
Who won the race?
A. runner A
Did each runner finish the race?
Yes