QUESTION IMAGE
Question
topic 3 drawing inferences
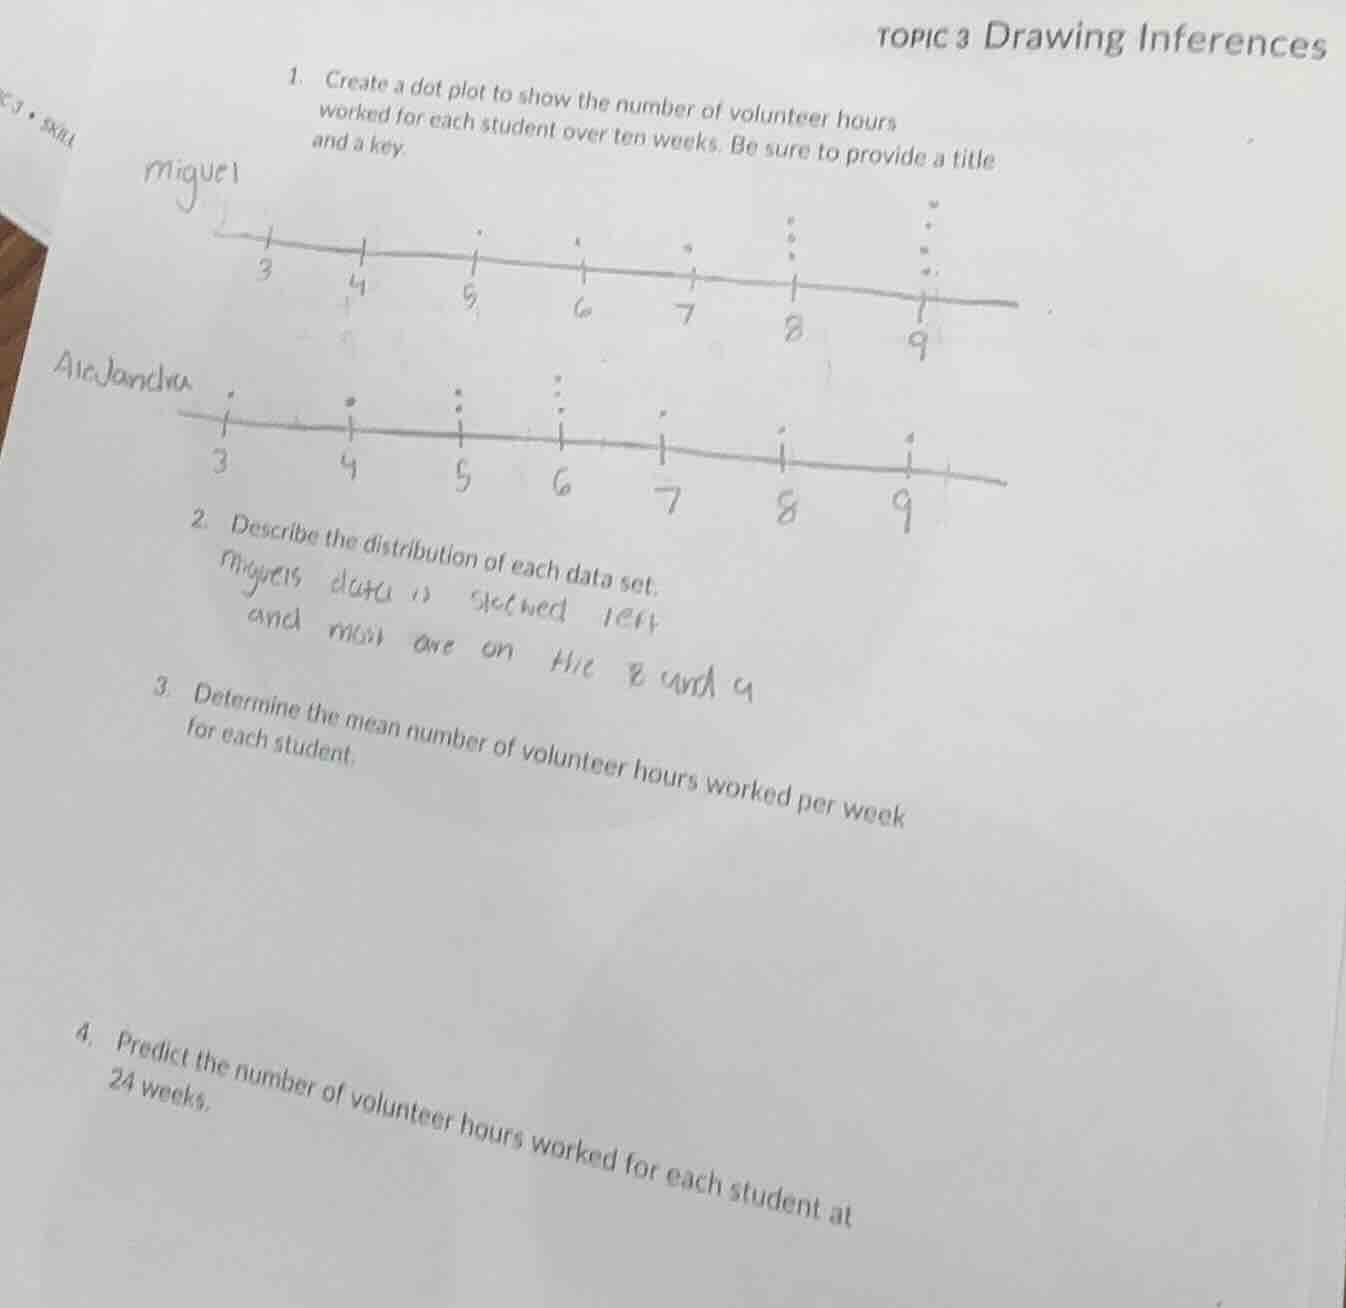
- create a dot plot to show the number of volunteer hours worked for each student over ten weeks. be sure to provide a title and a key.
- describe the distribution of each data set.
- determine the mean number of volunteer hours worked per week for each student.
- predict the number of volunteer hours worked for each student at 24 weeks.
Step1: Extract Miguel's data points
From dot plot: 3,4,5,6,7,8,8,9,9,9
Step2: Calculate Miguel's mean
Sum: $3+4+5+6+7+8+8+9+9+9=68$; Mean: $\frac{68}{10}=6.8$
Step3: Extract Alejandra's data points
From dot plot: 3,4,5,5,6,6,7,8,9,9
Step4: Calculate Alejandra's mean
Sum: $3+4+5+5+6+6+7+8+9+9=62$; Mean: $\frac{62}{10}=6.2$
Step5: Predict Miguel's 24-week hours
Multiply mean by 24: $6.8 \times 24=163.2$
Step6: Predict Alejandra's 24-week hours
Multiply mean by 24: $6.2 \times 24=148.8$

Snap & solve any problem in the app
Get step-by-step solutions on Sovi AI
Photo-based solutions with guided steps
Explore more problems and detailed explanations
- Dot Plot Titles & Key:
- Miguel's Plot: Miguel's Weekly Volunteer Hours (10 Weeks); Key: Each dot = 1 week
- Alejandra's Plot: Alejandra's Weekly Volunteer Hours (10 Weeks); Key: Each dot = 1 week
- Distribution Descriptions:
- Miguel's data: Skewed left, with the highest frequency (most dots) at 9 hours, and fewer values at lower hour counts.
- Alejandra's data: Roughly symmetric, with frequencies evenly spread across 3-9 hours, no strong skew.
- Mean Hours per Week:
- Miguel: 6.8 hours
- Alejandra: 6.2 hours
- 24-Week Predictions:
- Miguel: 163.2 hours
- Alejandra: 148.8 hours