QUESTION IMAGE
Question
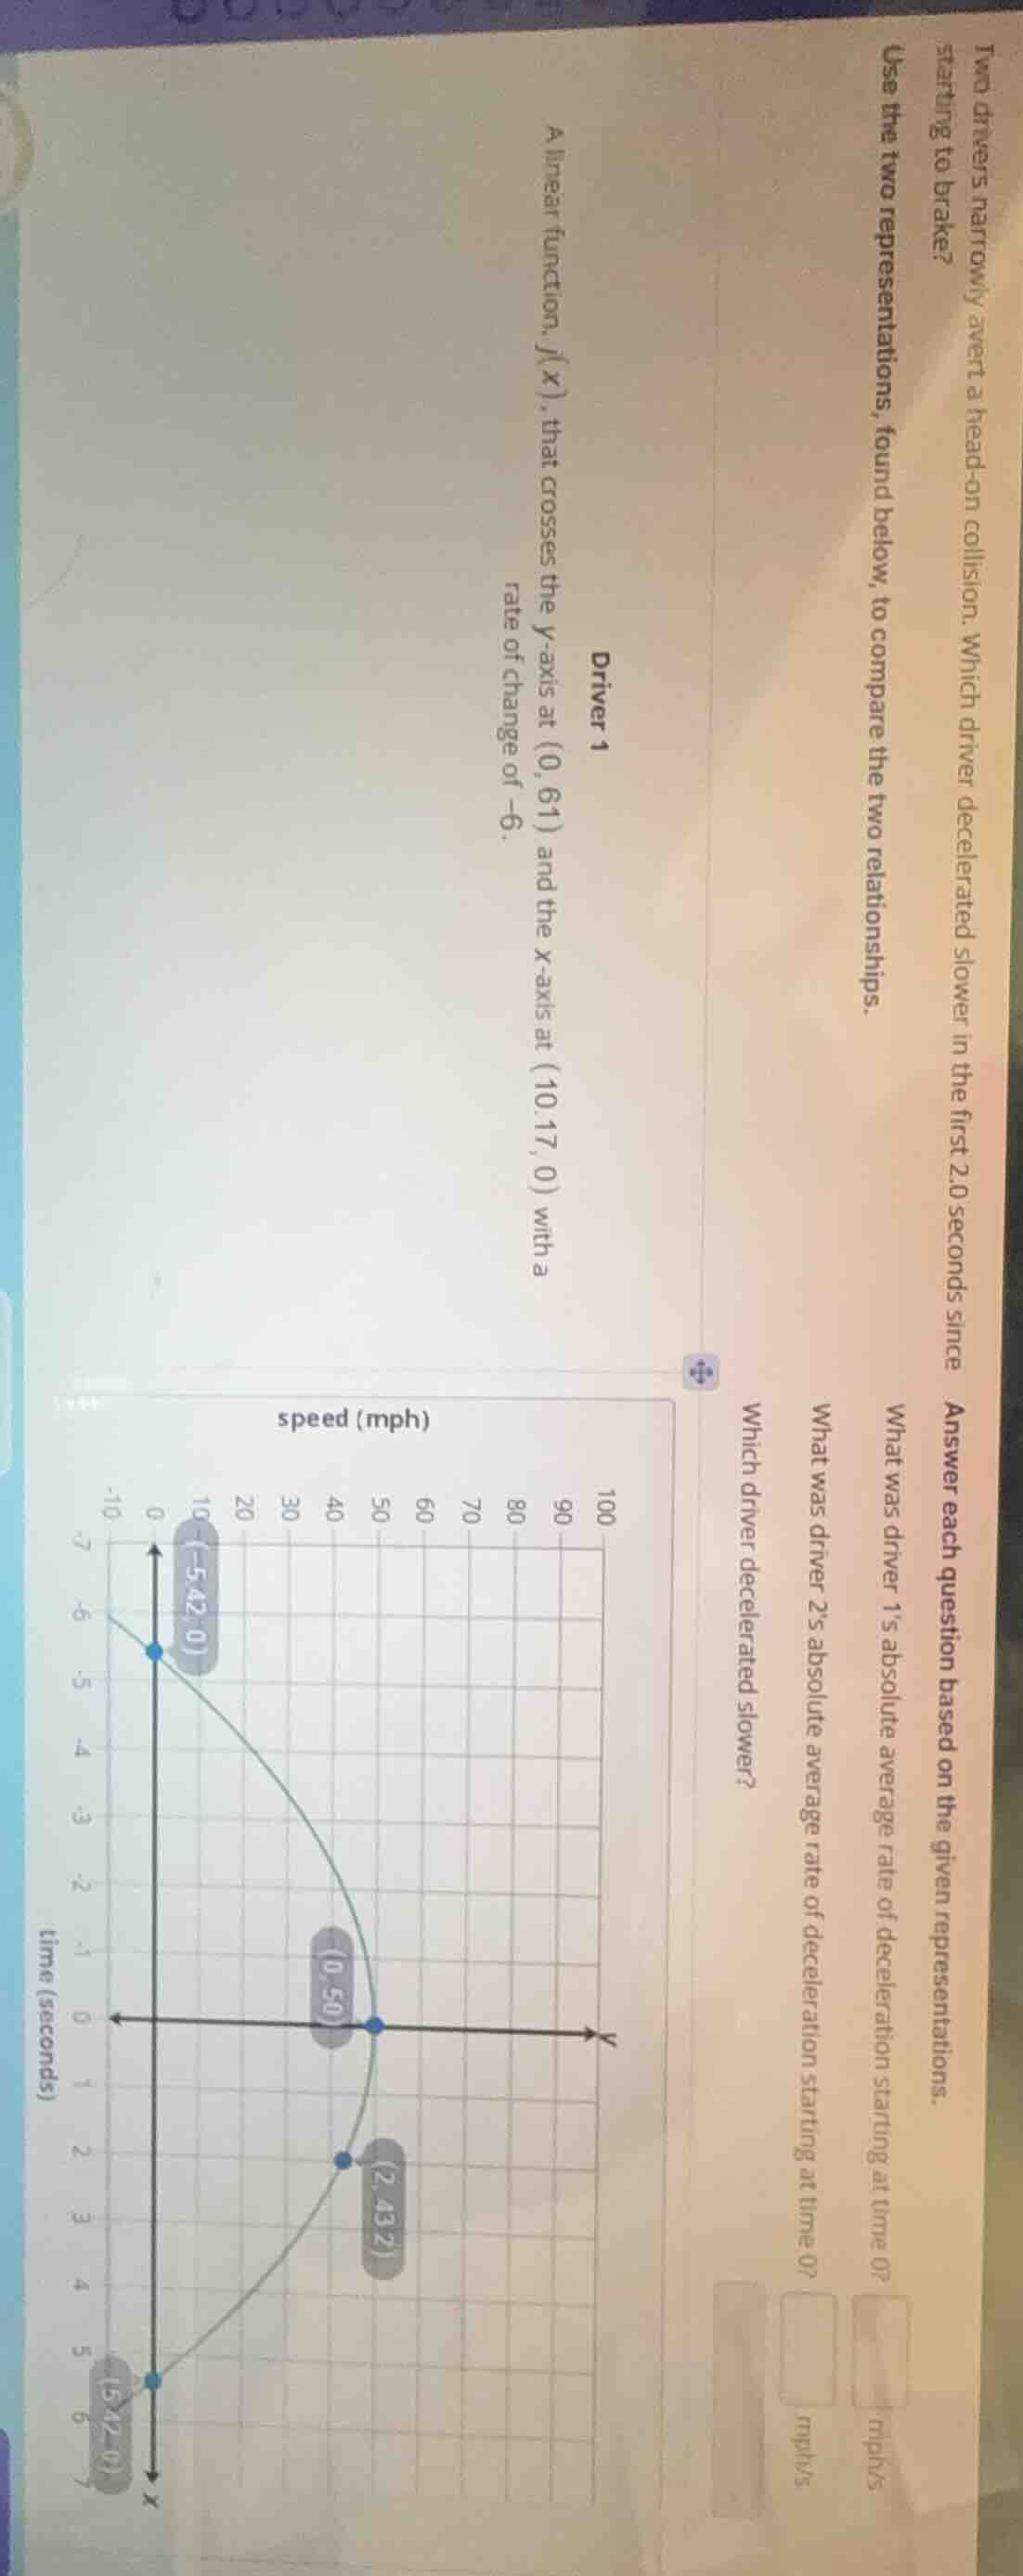
two drivers narrowly avert a head - on collision. which driver decelerated slower in the first 2.0 seconds since starting to brake? use the two representations, found below, to compare the two relationships. driver 1 a linear function, f(x), that crosses the y - axis at (0, 61) and the x - axis at (10.17, 0) with a rate of change of - 6. answer each question based on the given representations. what was driver 1’s absolute average rate of deceleration starting at time 0? what was driver 2’s absolute average rate of deceleration starting at time 0? which driver decelerated slower? the chart for driver 2 has speed (mph) on the y - axis and time (seconds) on the x - axis, with points (-5.42, 0), (0, 50), (2, 43.2), (5, 5.42) etc. and a curve connecting them.
Step1: Find Driver 1's deceleration
The rate of change (deceleration) of Driver 1's linear function is given as $-6$ mph/s. The absolute value is $| -6 | = 6$ mph/s.
Step2: Calculate Driver 2's deceleration
Use the average rate of change formula $\frac{\Delta y}{\Delta x} = \frac{y_2 - y_1}{x_2 - x_1}$. For $x_1=0, y_1=50$ and $x_2=2, y_2=43.2$:
$\frac{43.2 - 50}{2 - 0} = \frac{-6.8}{2} = -3.4$ mph/s. The absolute value is $| -3.4 | = 3.4$ mph/s.
Step3: Compare decelerations
Compare the absolute values: $3.4 < 6$. The smaller absolute value means slower deceleration.

Snap & solve any problem in the app
Get step-by-step solutions on Sovi AI
Photo-based solutions with guided steps
Explore more problems and detailed explanations
What was driver 1's absolute average rate of deceleration starting at time 0?
6 mph/s
What was driver 2's absolute average rate of deceleration starting at time 0?
3.4 mph/s
Which driver decelerated slower?
Driver 2