QUESTION IMAGE
Question
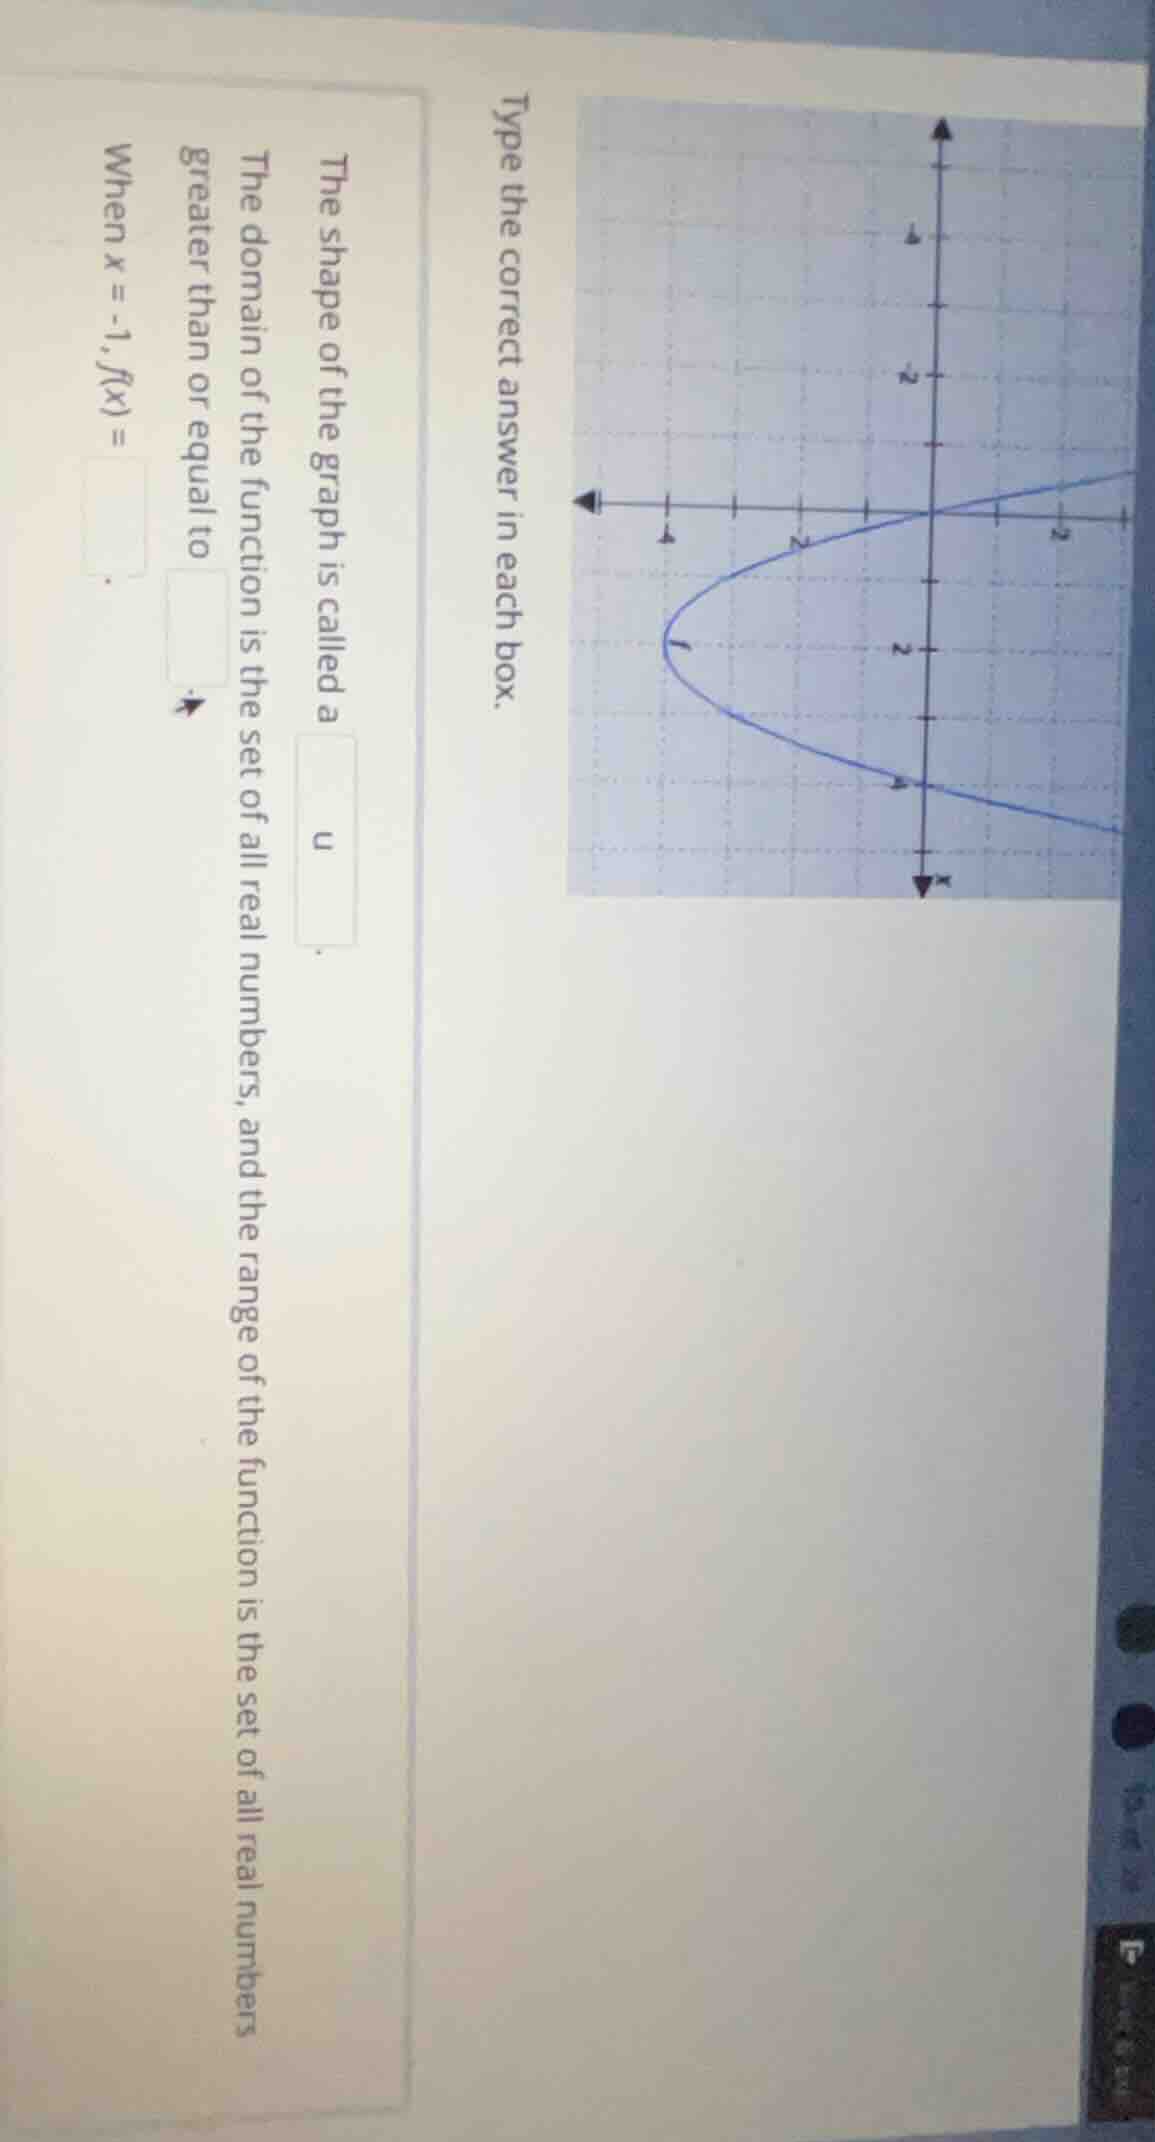
type the correct answer in each box. the shape of the graph is called a blank u. the domain of the function is the set of all real numbers, and the range of the function is the set of all real numbers greater than or equal to blank. when x = -1, f(x) = blank.
First Blank (Shape of the Graph)
The graph shown is a parabola that opens downward (or upward, but the key term for this U - shaped (or inverted U - shaped) graph of a quadratic function is a "parabola". The shape is characteristic of a quadratic function's graph, which is called a parabola.
For a parabola (quadratic function) that opens upward, the range is all real numbers greater than or equal to the y - coordinate of the vertex. From the graph, the vertex (the minimum point) has a y - coordinate of - 1, so the range is \( y\geq - 1 \).
Looking at the graph, when x=-1, the point on the parabola (since it's a function) has a y - value of 0 (assuming the graph passes through (-1, 0), maybe it's an x - intercept).

Snap & solve any problem in the app
Get step-by-step solutions on Sovi AI
Photo-based solutions with guided steps
Explore more problems and detailed explanations
parabola
Second Blank (Domain or Range - Let's assume it's the vertex's y - value for range start, but from the context "greater than or equal to" - looking at the graph, the vertex seems to be at ( - 4, - 1)? Wait, no, the graph's vertex (the minimum or maximum point). Wait, the graph shown: if it's a downward opening parabola? Wait, no, the blue curve: looking at the grid, the vertex (the highest or lowest point). Wait, the problem says "the range of the function is the set of all real numbers greater than or equal to...". So we need to find the minimum value of the function (if it opens upward) or maximum (if downward). Wait, the graph in the image: let's analyze. The curve seems to have a vertex (the lowest point) at, say, x=-4, y = - 1? Wait, no, maybe the vertex is at ( - 4, - 1)? Wait, no, the user's graph: let's assume the vertex (the minimum point) has a y - coordinate of - 1? Wait, no, the third part is when x=-1, f(x)=? Let's try to find the equation or use the graph.
Wait, maybe the first blank for the shape is "parabola", the second blank (range start) is - 1 (if the vertex is at y=-1), and when x = - 1, f(x)=0? Wait, no, let's re - examine.
Wait, the graph: the blue curve. Let's assume it's a parabola. The domain of a parabola (quadratic function) is all real numbers, and the range: if it opens upward, the range is \( y\geq k \) where \( k \) is the y - coordinate of the vertex. If it opens downward, \( y\leq k \). From the graph, let's say the vertex (the lowest point) is at (h, k) where k=-1. So the range is all real numbers greater than or equal to - 1. Then when x=-1, looking at the graph, maybe f(x)=0? Wait, maybe the x - intercept is at x=-1?