QUESTION IMAGE
Question
unit 6 formative
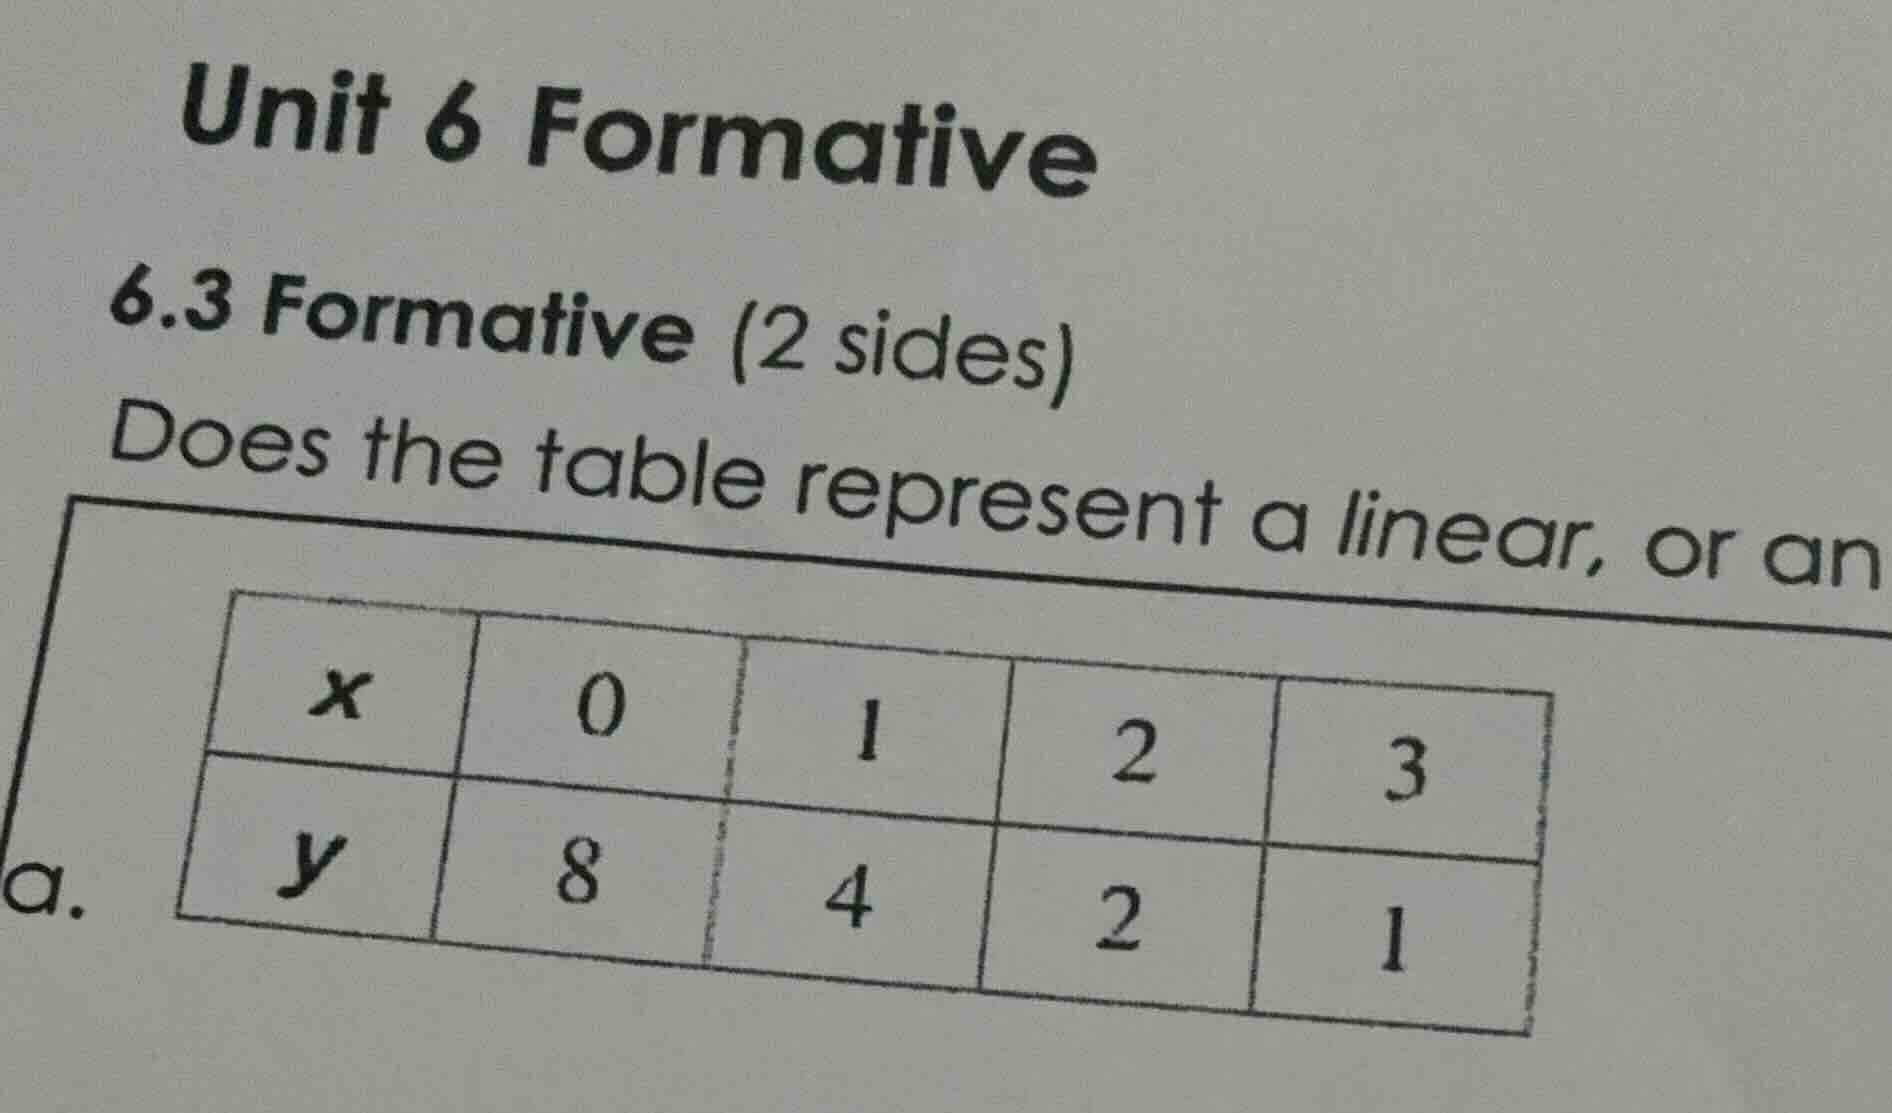
6.3 formative (2 sides)
does the table represent a linear, or an
a.
| x | 0 | 1 | 2 | 3 |
| y | 8 | 4 | 2 | 1 |
Step1: Calculate the differences in y-values
For a linear function, the difference in \( y \)-values (slope) should be constant when \( x \) increases by 1. Let's find the differences between consecutive \( y \)-values.
From \( x = 0 \) to \( x = 1 \): \( 4 - 8 = -4 \)
From \( x = 1 \) to \( x = 2 \): \( 2 - 4 = -2 \)
From \( x = 2 \) to \( x = 3 \): \( 1 - 2 = -1 \)
Step2: Analyze the differences
In a linear function, the rate of change (slope) should be constant. Here, the differences between consecutive \( y \)-values are \( -4, -2, -1 \), which are not constant. Now, let's check if it's exponential. For an exponential function, the ratio of consecutive \( y \)-values should be constant.
From \( x = 0 \) to \( x = 1 \): \( \frac{4}{8} = 0.5 \)
From \( x = 1 \) to \( x = 2 \): \( \frac{2}{4} = 0.5 \)
From \( x = 2 \) to \( x = 3 \): \( \frac{1}{2} = 0.5 \)
The ratio of consecutive \( y \)-values is constant (\( 0.5 \)), so the function is exponential.

Snap & solve any problem in the app
Get step-by-step solutions on Sovi AI
Photo-based solutions with guided steps
Explore more problems and detailed explanations
The table represents an exponential function.