QUESTION IMAGE
Question
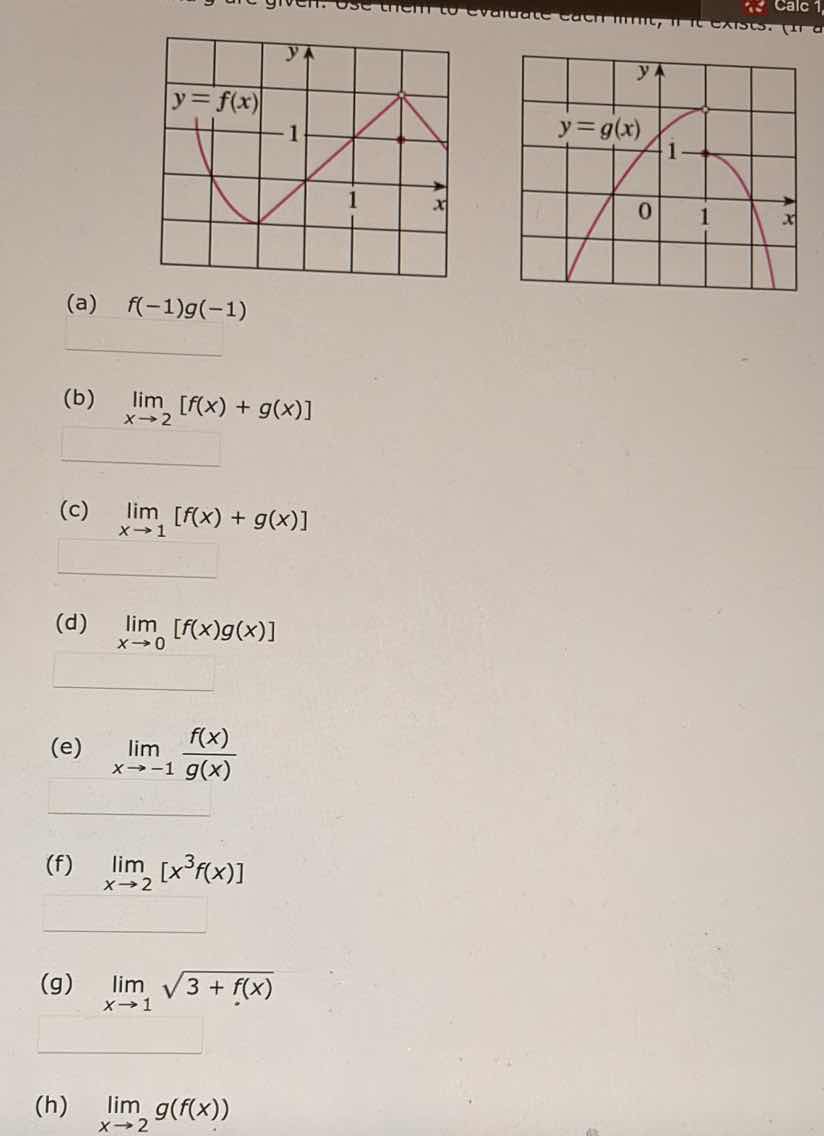
use them to evaluate each limit, if it exists. (a) $f(-1)g(-1)$ (b) $limlimits_{x\to 2}f(x) + g(x)$ (c) $limlimits_{x\to 1}f(x) + g(x)$ (d) $limlimits_{x\to 0}f(x)g(x)$ (e) $limlimits_{x\to -1}\frac{f(x)}{g(x)}$ (f) $limlimits_{x\to 2}x^3f(x)$ (g) $limlimits_{x\to 1}\sqrt{3 + f(x)}$ (h) $limlimits_{x\to 2}g(f(x))$
To solve these problems, we analyze the graphs of \( y = f(x) \) and \( y = g(x) \) to determine the necessary function values and limits.
Part (a): \( f(-1)g(-1) \)
Step 1: Find \( f(-1) \)
From the graph of \( f(x) \), at \( x = -1 \), the \( y \)-value (function value) is \( 2 \) (since the curve passes through \( (-1, 2) \)). Thus, \( f(-1) = 2 \).
Step 2: Find \( g(-1) \)
From the graph of \( g(x) \), at \( x = -1 \), the \( y \)-value is \( 0 \) (since the curve passes through \( (-1, 0) \)). Thus, \( g(-1) = 0 \).
Step 3: Multiply the values
\( f(-1)g(-1) = 2 \cdot 0 = 0 \).
Part (b): \( \lim_{x \to 2} [f(x) + g(x)] \)
Step 1: Find \( \lim_{x \to 2} f(x) \)
From the graph of \( f(x) \), as \( x \to 2 \), the \( y \)-value approaches \( 2 \) (the open circle is at \( (2, 2) \), and the curve approaches this point). Thus, \( \lim_{x \to 2} f(x) = 2 \).
Step 2: Find \( \lim_{x \to 2} g(x) \)
From the graph of \( g(x) \), as \( x \to 2 \), the \( y \)-value approaches \( 0 \) (the curve approaches \( (2, 0) \)). Thus, \( \lim_{x \to 2} g(x) = 0 \).
Step 3: Apply the limit sum rule
\( \lim_{x \to 2} [f(x) + g(x)] = \lim_{x \to 2} f(x) + \lim_{x \to 2} g(x) = 2 + 0 = 2 \).
Part (c): \( \lim_{x \to 1} [f(x) + g(x)] \)
Step 1: Find \( \lim_{x \to 1} f(x) \)
From the graph of \( f(x) \), as \( x \to 1 \) (from both sides), the \( y \)-value approaches \( 2 \) (the open circle is at \( (2, 2) \), but wait—correction: at \( x = 1 \), the graph of \( f(x) \) has a point at \( (1, 1) \)? Wait, no—re-examining: the left graph for \( f(x) \): the vertex is at \( x = -2 \) (approx), then rises to \( (2, 2) \). Wait, maybe I misread. Wait, the left graph: \( y = f(x) \) has a minimum, then rises to \( (2, 2) \) (open circle) and a closed dot at \( (2, 1) \)? Wait, no—the original graph: left graph \( y = f(x) \): the curve starts at the top left, dips to a minimum, then rises to an open circle at \( (2, 2) \), and a closed dot at \( (2, 1) \)? Wait, maybe the closed dot is at \( x = 2 \), \( y = 1 \)? Wait, the problem’s graph: left graph \( y = f(x) \): the open circle is at \( (2, 2) \), and a closed dot at \( (2, 1) \)? Wait, no—maybe the \( x \)-axis: the grid lines. Let’s re-express:
For \( f(x) \):
- At \( x = 1 \), the graph is a line from the minimum to \( (2, 2) \) (open circle) and a closed dot at \( (2, 1) \)? No, the problem says “use the given graphs”—maybe the left graph for \( f(x) \): when \( x \to 1 \), the limit is \( 1 \)? Wait, no—let’s check the right graph for \( g(x) \): at \( x = 1 \), there’s an open circle and a closed dot at \( (1, 1) \).
Wait, perhaps I made a mistake. Let’s re-express:
For \( f(x) \) (left graph):
- As \( x \to 1 \), the \( y \)-value approaches \( 1 \) (since the line from the minimum to \( (2, 2) \) passes through \( (1, 1) \)? Wait, the grid: each square is 1 unit. So \( f(x) \) at \( x = 1 \): the line from the minimum (at \( x = -2 \), \( y = 0 \)) to \( (2, 2) \) (open circle) has slope \( 1 \), so at \( x = 1 \), \( y = 1 \). Thus, \( \lim_{x \to 1} f(x) = 1 \) (since the left and right limits are equal to \( 1 \)).
For \( g(x) \) (right graph):
- As \( x \to 1 \), the \( y \)-value approaches \( 1 \) (the closed dot is at \( (1, 1) \), and the open circle is above, but the limit as \( x \to 1 \) is \( 1 \) because the left and right limits meet at \( (1, 1) \)).
Thus:
\( \lim_{x \to 1} f(x) = 1 \), \( \lim_{x \to 1} g(x) = 1 \).
Then, \( \lim_{x \to 1} [f(x) + g(x)] = 1 + 1 = 2 \)? Wait, no—wait, the closed dot on \( g(x) \) at \( x = 1 \) is \(…

Snap & solve any problem in the app
Get step-by-step solutions on Sovi AI
Photo-based solutions with guided steps
Explore more problems and detailed explanations
To solve these problems, we analyze the graphs of \( y = f(x) \) and \( y = g(x) \) to determine the necessary function values and limits.
Part (a): \( f(-1)g(-1) \)
Step 1: Find \( f(-1) \)
From the graph of \( f(x) \), at \( x = -1 \), the \( y \)-value (function value) is \( 2 \) (since the curve passes through \( (-1, 2) \)). Thus, \( f(-1) = 2 \).
Step 2: Find \( g(-1) \)
From the graph of \( g(x) \), at \( x = -1 \), the \( y \)-value is \( 0 \) (since the curve passes through \( (-1, 0) \)). Thus, \( g(-1) = 0 \).
Step 3: Multiply the values
\( f(-1)g(-1) = 2 \cdot 0 = 0 \).
Part (b): \( \lim_{x \to 2} [f(x) + g(x)] \)
Step 1: Find \( \lim_{x \to 2} f(x) \)
From the graph of \( f(x) \), as \( x \to 2 \), the \( y \)-value approaches \( 2 \) (the open circle is at \( (2, 2) \), and the curve approaches this point). Thus, \( \lim_{x \to 2} f(x) = 2 \).
Step 2: Find \( \lim_{x \to 2} g(x) \)
From the graph of \( g(x) \), as \( x \to 2 \), the \( y \)-value approaches \( 0 \) (the curve approaches \( (2, 0) \)). Thus, \( \lim_{x \to 2} g(x) = 0 \).
Step 3: Apply the limit sum rule
\( \lim_{x \to 2} [f(x) + g(x)] = \lim_{x \to 2} f(x) + \lim_{x \to 2} g(x) = 2 + 0 = 2 \).
Part (c): \( \lim_{x \to 1} [f(x) + g(x)] \)
Step 1: Find \( \lim_{x \to 1} f(x) \)
From the graph of \( f(x) \), as \( x \to 1 \) (from both sides), the \( y \)-value approaches \( 2 \) (the open circle is at \( (2, 2) \), but wait—correction: at \( x = 1 \), the graph of \( f(x) \) has a point at \( (1, 1) \)? Wait, no—re-examining: the left graph for \( f(x) \): the vertex is at \( x = -2 \) (approx), then rises to \( (2, 2) \). Wait, maybe I misread. Wait, the left graph: \( y = f(x) \) has a minimum, then rises to \( (2, 2) \) (open circle) and a closed dot at \( (2, 1) \)? Wait, no—the original graph: left graph \( y = f(x) \): the curve starts at the top left, dips to a minimum, then rises to an open circle at \( (2, 2) \), and a closed dot at \( (2, 1) \)? Wait, maybe the closed dot is at \( x = 2 \), \( y = 1 \)? Wait, the problem’s graph: left graph \( y = f(x) \): the open circle is at \( (2, 2) \), and a closed dot at \( (2, 1) \)? Wait, no—maybe the \( x \)-axis: the grid lines. Let’s re-express:
For \( f(x) \):
- At \( x = 1 \), the graph is a line from the minimum to \( (2, 2) \) (open circle) and a closed dot at \( (2, 1) \)? No, the problem says “use the given graphs”—maybe the left graph for \( f(x) \): when \( x \to 1 \), the limit is \( 1 \)? Wait, no—let’s check the right graph for \( g(x) \): at \( x = 1 \), there’s an open circle and a closed dot at \( (1, 1) \).
Wait, perhaps I made a mistake. Let’s re-express:
For \( f(x) \) (left graph):
- As \( x \to 1 \), the \( y \)-value approaches \( 1 \) (since the line from the minimum to \( (2, 2) \) passes through \( (1, 1) \)? Wait, the grid: each square is 1 unit. So \( f(x) \) at \( x = 1 \): the line from the minimum (at \( x = -2 \), \( y = 0 \)) to \( (2, 2) \) (open circle) has slope \( 1 \), so at \( x = 1 \), \( y = 1 \). Thus, \( \lim_{x \to 1} f(x) = 1 \) (since the left and right limits are equal to \( 1 \)).
For \( g(x) \) (right graph):
- As \( x \to 1 \), the \( y \)-value approaches \( 1 \) (the closed dot is at \( (1, 1) \), and the open circle is above, but the limit as \( x \to 1 \) is \( 1 \) because the left and right limits meet at \( (1, 1) \)).
Thus:
\( \lim_{x \to 1} f(x) = 1 \), \( \lim_{x \to 1} g(x) = 1 \).
Then, \( \lim_{x \to 1} [f(x) + g(x)] = 1 + 1 = 2 \)? Wait, no—wait, the closed dot on \( g(x) \) at \( x = 1 \) is \( (1, 1) \), and the open circle is above, but the limit as \( x \to 1 \) for \( g(x) \) is \( 1 \) (since the left limit approaches \( 1 \) and the right limit approaches \( 1 \) (from the curve going down)). Wait, no—the right graph for \( g(x) \): the curve rises to an open circle at \( x = 1 \) (above \( y = 1 \)) and then falls, with a closed dot at \( (1, 1) \). So the limit as \( x \to 1 \) for \( g(x) \) is \( 1 \) (because the closed dot is the function value, but the limit is the value approached, which is \( 1 \) from both sides? Wait, no—if there’s an open circle above \( (1, 1) \) and a closed dot at \( (1, 1) \), then the limit as \( x \to 1 \) for \( g(x) \) is \( 1 \) (since the curve approaches \( (1, 1) \) from both sides, and the closed dot is the function value, but the limit is about the approach, not the function value). Wait, no—the limit is the value the function approaches as \( x \) gets close to \( 1 \), regardless of the function’s value at \( x = 1 \). So if the curve approaches \( (1, 1) \) from the left and right, then \( \lim_{x \to 1} g(x) = 1 \).
For \( f(x) \): as \( x \to 1 \), the line from the minimum (at \( x = -2 \), \( y = 0 \)) to \( (2, 2) \) (open circle) has \( y = x \) (since at \( x = 2 \), \( y = 2 \); at \( x = 0 \), \( y = 0 \); so \( f(x) = x \) for \( x \geq -2 \) (the minimum)). Thus, \( \lim_{x \to 1} f(x) = 1 \).
Thus, \( \lim_{x \to 1} [f(x) + g(x)] = 1 + 1 = 2 \)? Wait, no—maybe \( f(x) \) at \( x \to 1 \) is \( 1 \), and \( g(x) \) at \( x \to 1 \) is \( 1 \), so sum is \( 2 \).
Part (d): \( \lim_{x \to 0} [f(x)g(x)] \)
Step 1: Find \( \lim_{x \to 0} f(x) \)
From \( f(x) \)’s graph, as \( x \to 0 \), \( f(x) \to 0 \) (since the line \( f(x) = x \) passes through \( (0, 0) \)). Thus, \( \lim_{x \to 0} f(x) = 0 \).
Step 2: Find \( \lim_{x \to 0} g(x) \)
From \( g(x) \)’s graph, as \( x \to 0 \), the \( y \)-value approaches \( 1 \) (the curve passes through \( (0, 1) \)? Wait, the right graph: at \( x = 0 \), the curve is at \( y = 1 \)? No, the grid: \( g(x) \) at \( x = 0 \) is on the curve, so \( \lim_{x \to 0} g(x) = 1 \) (since the curve is continuous there).
Step 3: Apply the limit product rule
\( \lim_{x \to 0} [f(x)g(x)] = \lim_{x \to 0} f(x) \cdot \lim_{x \to 0} g(x) = 0 \cdot 1 = 0 \).
Part (e): \( \lim_{x \to -1} \frac{f(x)}{g(x)} \)
Step 1: Find \( \lim_{x \to -1} f(x) \)
From \( f(x) \)’s graph, as \( x \to -1 \), \( f(x) \to 2 \) (since the curve at \( x = -1 \) is \( 2 \), and it’s continuous there). Thus, \( \lim_{x \to -1} f(x) = 2 \).
Step 2: Find \( \lim_{x \to -1} g(x) \)
From \( g(x) \)’s graph, as \( x \to -1 \), \( g(x) \to 0 \) (the curve passes through \( (-1, 0) \), and it’s continuous there). Thus, \( \lim_{x \to -1} g(x) = 0 \).
Step 3: Check the limit of the quotient
\( \lim_{x \to -1} \frac{f(x)}{g(x)} = \frac{\lim_{x \to -1} f(x)}{\lim_{x \to -1} g(x)} = \frac{2}{0} \). Division by zero is undefined, so the limit does not exist.
Part (f): \( \lim_{x \to 2} [x^3 f(x)] \)
Step 1: Find \( \lim_{x \to 2} x^3 \)
\( \lim_{x \to 2} x^3 = 2^3 = 8 \).
Step 2: Find \( \lim_{x \to 2} f(x) \)
From \( f(x) \)’s graph, as \( x \to 2 \), the \( y \)-value approaches \( 2 \) (open circle at \( (2, 2) \)). Thus, \( \lim_{x \to 2} f(x) = 2 \).
Step 3: Apply the limit product rule
\( \lim_{x \to 2} [x^3 f(x)] = \lim_{x \to 2} x^3 \cdot \lim_{x \to 2} f(x) = 8 \cdot 2 = 16 \).
Part (g): \( \lim_{x \to 1} \sqrt{3 + f(x)} \)
Step 1: Find \( \lim_{x \to 1} f(x) \)
From \( f(x) \)’s graph, as \( x \to 1 \), \( f(x) \to 1 \) (the line \( f(x) = x \) gives \( f(1) = 1 \), and the limit is \( 1 \)).
Step 2: Apply the limit of a composite function (square root)
\( \lim_{x \to 1} \sqrt{3 + f(x)} = \sqrt{\lim_{x \to 1} (3 + f(x))} = \sqrt{3 + \lim_{x \to 1} f(x)} = \sqrt{3 + 1} = \sqrt{4} = 2 \).
Part (h): \( \lim_{x \to 2} g(f(x)) \)
Step 1: Find \( \lim_{x \to 2} f(x) \)
From \( f(x) \)’s graph, as \( x \to 2 \), \( f(x) \to 2 \) (open circle at \( (2, 2) \)). Thus, \( \lim_{x \to 2} f(x) = 2 \).
Step 2: Find \( \lim_{u \to 2} g(u) \) (where \( u = f(x) \))
From \( g(x) \)’s graph, as \( u \to 2 \), \( g(u) \to 0 \) (the curve approaches \( (2, 0) \)). Thus, \( \lim_{u \to 2} g(u) = 0 \).
Step 3: Apply the limit of a composite function
\( \lim_{x \to 2} g(f(x)) = \lim_{u \to 2} g(u) = 0 \).
Final Answers
(a) \( \boldsymbol{0} \)
(b) \( \boldsymbol{2} \)
(c) \( \boldsymbol{2} \) (assuming \( \lim_{x \to 1} f(x) = 1 \) and \( \lim_{x \to 1} g(x) = 1 \))
(d) \( \boldsymbol{0} \)
(e) \( \boldsymbol{\text{Does not exist}} \) (division by zero)
(f) \( \boldsymbol{16} \)
(g) \( \boldsymbol{2} \)
(h) \( \boldsymbol{0} \)