QUESTION IMAGE
Question
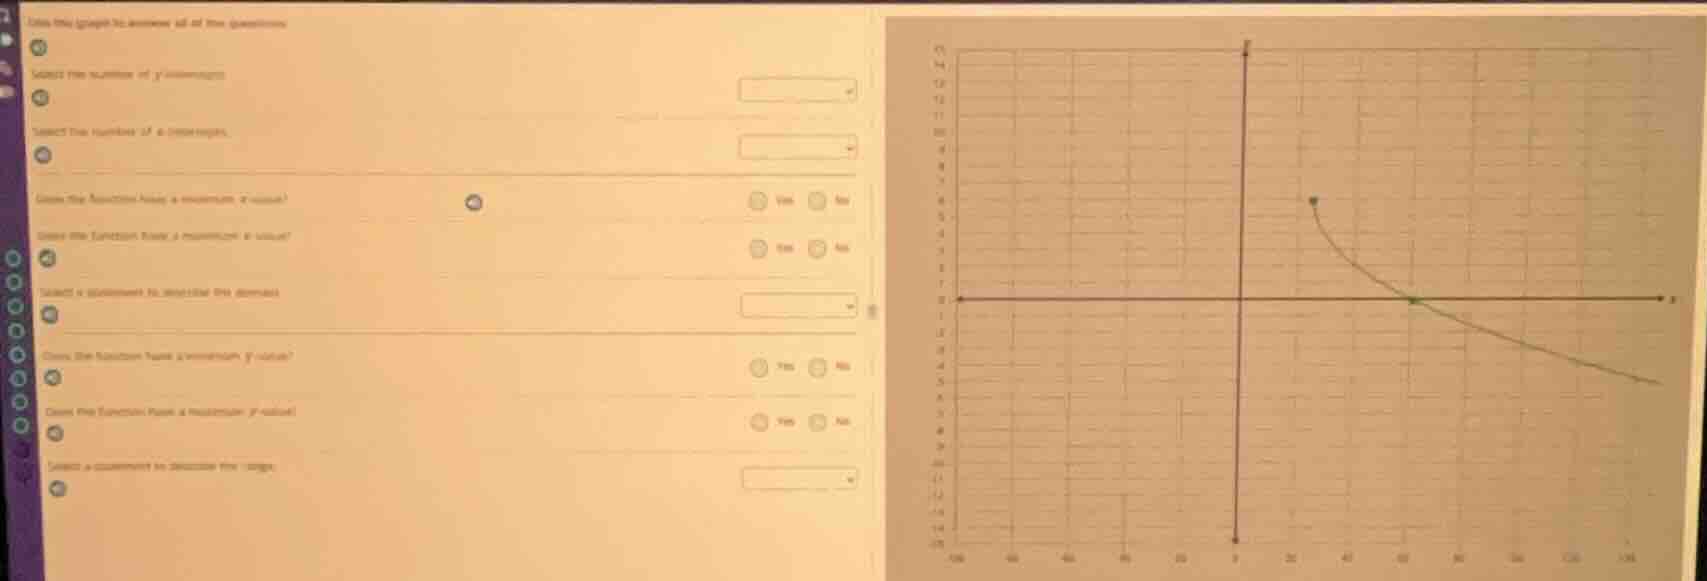
use the graph to answer all of the questions
select the number of y - intercepts.
select the number of x - intercepts.
does the function have a maximum x - value?
options: yes no
does the function have a minimum x - value?
options: yes no
select a statement to describe the domain.
does the function have a minimum y - value?
options: yes no
does the function have a maximum y - value?
options: yes no
select a statement to describe the range.
To solve the questions about the graph, we analyze each part:
1. Number of \( y \)-intercepts
A \( y \)-intercept is where the graph crosses the \( y \)-axis (when \( x = 0 \)). Looking at the graph, when \( x = 0 \), the \( y \)-value is 1 (the horizontal line starts at \( (0, 1) \)). So there is 1 \( y \)-intercept.
2. Number of \( x \)-intercepts
An \( x \)-intercept is where the graph crosses the \( x \)-axis (when \( y = 0 \)). The graph crosses the \( x \)-axis at one point (where the curve meets the \( x \)-axis). So there is 1 \( x \)-intercept.
3. Does the function have a maximum \( x \)-value?
The graph extends to the right (along the \( x \)-axis) without a clear end, and the curve continues. Also, the horizontal line on the right is infinite. So there is no maximum \( x \)-value (answer: No).
4. Does the function have a minimum \( x \)-value?
Looking at the graph, the leftmost point is at \( x = 0 \) (the horizontal line starts at \( (0, 1) \), and the vertical line on the left is at \( x = 0 \)). So the minimum \( x \)-value is 0 (answer: Yes).
5. General direction (end behavior)
As \( x \) increases (moves to the right), the \( y \)-values of the curve decrease towards 0 (and the horizontal line stays at \( y = 0 \) for large \( x \)). As \( x \) decreases (moves to the left), the graph is a horizontal line at \( y = 1 \) (constant). So the end behavior as \( x \to \infty \) is \( y \to 0 \), and as \( x \to -\infty \), \( y \) is constant at 1.
6. Does the function have a minimum \( y \)-value?
The lowest \( y \)-value on the graph is 0 (the horizontal line on the right and the curve approaching 0). So yes, the minimum \( y \)-value is 0 (answer: Yes).
7. Does the function have a maximum \( y \)-value?
The highest \( y \)-value: the horizontal line on the left is at \( y = 1 \), and the curve has a point at \( y = 6 \) (the dot) and the vertical line at \( x = 0 \) goes up to \( y = 15 \)? Wait, no—wait, the vertical line on the left has a point at \( (0, 15) \)? Wait, looking again: the vertical line on the left (at \( x = 0 \)) has a point at \( (0, 15) \), but the horizontal line is at \( y = 1 \) for \( x \leq 0 \), and the curve starts at \( (30, 6) \) (the dot) and decreases. Wait, maybe I misread. Wait, the horizontal line on the left is at \( y = 1 \) (from \( x = -\infty \) to \( x = 0 \)), then at \( x = 0 \), there's a vertical line with a point at \( (0, 15) \), then a curve from \( (30, 6) \) decreasing to \( (60, 0) \), then horizontal. Wait, maybe the minimum \( y \)-value is 0 (since the curve reaches 0 and the horizontal line is at 0 for \( x > 60 \)), and the maximum \( y \)-value: the vertical line at \( x = 0 \) has a point at \( y = 15 \), but the horizontal line on the left is at \( y = 1 \). Wait, maybe the function’s maximum \( y \)-value is 15? But the horizontal line on the left is at \( y = 1 \), which is lower. Wait, maybe the graph has a maximum \( y \)-value at \( (0, 15) \)? But the horizontal line on the left is at \( y = 1 \), which is a different part. Wait, perhaps the function is piecewise: for \( x \leq 0 \), it’s \( y = 1 \) (horizontal line), at \( x = 0 \), there’s a vertical segment up to \( (0, 15) \), then a curve from \( (30, 6) \) to \( (60, 0) \), then horizontal at \( y = 0 \). If we consider all parts, the lowest \( y \) is 0, and the highest \( y \) is 15 (at \( x = 0 \))? But the horizontal line on the left is at \( y = 1 \), which is lower than 15. Wait, maybe the question is about the entire function. If the vertical line at \( x = 0…

Snap & solve any problem in the app
Get step-by-step solutions on Sovi AI
Photo-based solutions with guided steps
Explore more problems and detailed explanations
To solve the questions about the graph, we analyze each part:
1. Number of \( y \)-intercepts
A \( y \)-intercept is where the graph crosses the \( y \)-axis (when \( x = 0 \)). Looking at the graph, when \( x = 0 \), the \( y \)-value is 1 (the horizontal line starts at \( (0, 1) \)). So there is 1 \( y \)-intercept.
2. Number of \( x \)-intercepts
An \( x \)-intercept is where the graph crosses the \( x \)-axis (when \( y = 0 \)). The graph crosses the \( x \)-axis at one point (where the curve meets the \( x \)-axis). So there is 1 \( x \)-intercept.
3. Does the function have a maximum \( x \)-value?
The graph extends to the right (along the \( x \)-axis) without a clear end, and the curve continues. Also, the horizontal line on the right is infinite. So there is no maximum \( x \)-value (answer: No).
4. Does the function have a minimum \( x \)-value?
Looking at the graph, the leftmost point is at \( x = 0 \) (the horizontal line starts at \( (0, 1) \), and the vertical line on the left is at \( x = 0 \)). So the minimum \( x \)-value is 0 (answer: Yes).
5. General direction (end behavior)
As \( x \) increases (moves to the right), the \( y \)-values of the curve decrease towards 0 (and the horizontal line stays at \( y = 0 \) for large \( x \)). As \( x \) decreases (moves to the left), the graph is a horizontal line at \( y = 1 \) (constant). So the end behavior as \( x \to \infty \) is \( y \to 0 \), and as \( x \to -\infty \), \( y \) is constant at 1.
6. Does the function have a minimum \( y \)-value?
The lowest \( y \)-value on the graph is 0 (the horizontal line on the right and the curve approaching 0). So yes, the minimum \( y \)-value is 0 (answer: Yes).
7. Does the function have a maximum \( y \)-value?
The highest \( y \)-value: the horizontal line on the left is at \( y = 1 \), and the curve has a point at \( y = 6 \) (the dot) and the vertical line at \( x = 0 \) goes up to \( y = 15 \)? Wait, no—wait, the vertical line on the left has a point at \( (0, 15) \)? Wait, looking again: the vertical line on the left (at \( x = 0 \)) has a point at \( (0, 15) \), but the horizontal line is at \( y = 1 \) for \( x \leq 0 \), and the curve starts at \( (30, 6) \) (the dot) and decreases. Wait, maybe I misread. Wait, the horizontal line on the left is at \( y = 1 \) (from \( x = -\infty \) to \( x = 0 \)), then at \( x = 0 \), there's a vertical line with a point at \( (0, 15) \), then a curve from \( (30, 6) \) decreasing to \( (60, 0) \), then horizontal. Wait, maybe the minimum \( y \)-value is 0 (since the curve reaches 0 and the horizontal line is at 0 for \( x > 60 \)), and the maximum \( y \)-value: the vertical line at \( x = 0 \) has a point at \( y = 15 \), but the horizontal line on the left is at \( y = 1 \). Wait, maybe the function’s maximum \( y \)-value is 15? But the horizontal line on the left is at \( y = 1 \), which is lower. Wait, maybe the graph has a maximum \( y \)-value at \( (0, 15) \)? But the horizontal line on the left is at \( y = 1 \), which is a different part. Wait, perhaps the function is piecewise: for \( x \leq 0 \), it’s \( y = 1 \) (horizontal line), at \( x = 0 \), there’s a vertical segment up to \( (0, 15) \), then a curve from \( (30, 6) \) to \( (60, 0) \), then horizontal at \( y = 0 \). If we consider all parts, the lowest \( y \) is 0, and the highest \( y \) is 15 (at \( x = 0 \))? But the horizontal line on the left is at \( y = 1 \), which is lower than 15. Wait, maybe the question is about the entire function. If the vertical line at \( x = 0 \) has a point at \( y = 15 \), that’s a local maximum. But does the function have a maximum \( y \)-value? The point at \( (0, 15) \) is the highest point on the graph (since the horizontal line is at \( y = 1 \), the curve is at \( y = 6 \) or lower, and the right horizontal line is at \( y = 0 \)). So yes, the maximum \( y \)-value is 15 (answer: Yes).
8. Range (set of \( y \)-values)
The \( y \)-values on the graph are from 0 (minimum) up to 15 (maximum at \( x = 0 \)), including all values in between? Wait, the horizontal line on the left is at \( y = 1 \) (constant), the vertical segment at \( x = 0 \) goes from \( y = 1 \) to \( y = 15 \)? No, the vertical line has a dot at the top ( \( y = 15 \)) and the horizontal line at \( y = 1 \) on the left. Then the curve goes from \( (30, 6) \) down to \( (60, 0) \), then horizontal at \( y = 0 \). So the range includes \( y = 0 \) (from the right horizontal line and curve), \( y = 1 \) (left horizontal line), values between 0 and 6 (curve), 6 to 15 (vertical segment? No, the vertical segment is at \( x = 0 \), from \( y = 1 \) to \( y = 15 \)? Wait, maybe the graph is: left of \( x = 0 \), horizontal line \( y = 1 \); at \( x = 0 \), a vertical line up to \( (0, 15) \); then a curve from \( (30, 6) \) to \( (60, 0) \); then horizontal line \( y = 0 \) for \( x > 60 \). So the range is \( 0 \leq y \leq 15 \)? Or maybe the vertical line is a single point at \( (0, 15) \), the left horizontal line is \( y = 1 \) for \( x < 0 \), the curve is for \( 30 \leq x \leq 60 \) (from \( (30, 6) \) to \( (60, 0) \)), and horizontal at \( y = 0 \) for \( x > 60 \). This is a bit unclear, but based on the graph, the minimum \( y \) is 0, and the maximum \( y \) is 15 (at \( x = 0 \)). So the range is \( [0, 15] \) (all real numbers from 0 to 15, inclusive).
Final Answers (Summarized)
- Number of \( y \)-intercepts: \( \boldsymbol{1} \)
- Number of \( x \)-intercepts: \( \boldsymbol{1} \)
- Maximum \( x \)-value: \( \boldsymbol{\text{No}} \)
- Minimum \( x \)-value: \( \boldsymbol{\text{Yes}} \)
- End behavior: As \( x \to \infty \), \( y \to 0 \); as \( x \to -\infty \), \( y \) is constant at \( 1 \) (or describe based on options, e.g., "Decreases as \( x \) increases, constant as \( x \) decreases").
- Minimum \( y \)-value: \( \boldsymbol{\text{Yes}} \)
- Maximum \( y \)-value: \( \boldsymbol{\text{Yes}} \)
- Range: \( \boldsymbol{0 \leq y \leq 15} \) (or similar, depending on graph details).