QUESTION IMAGE
Question
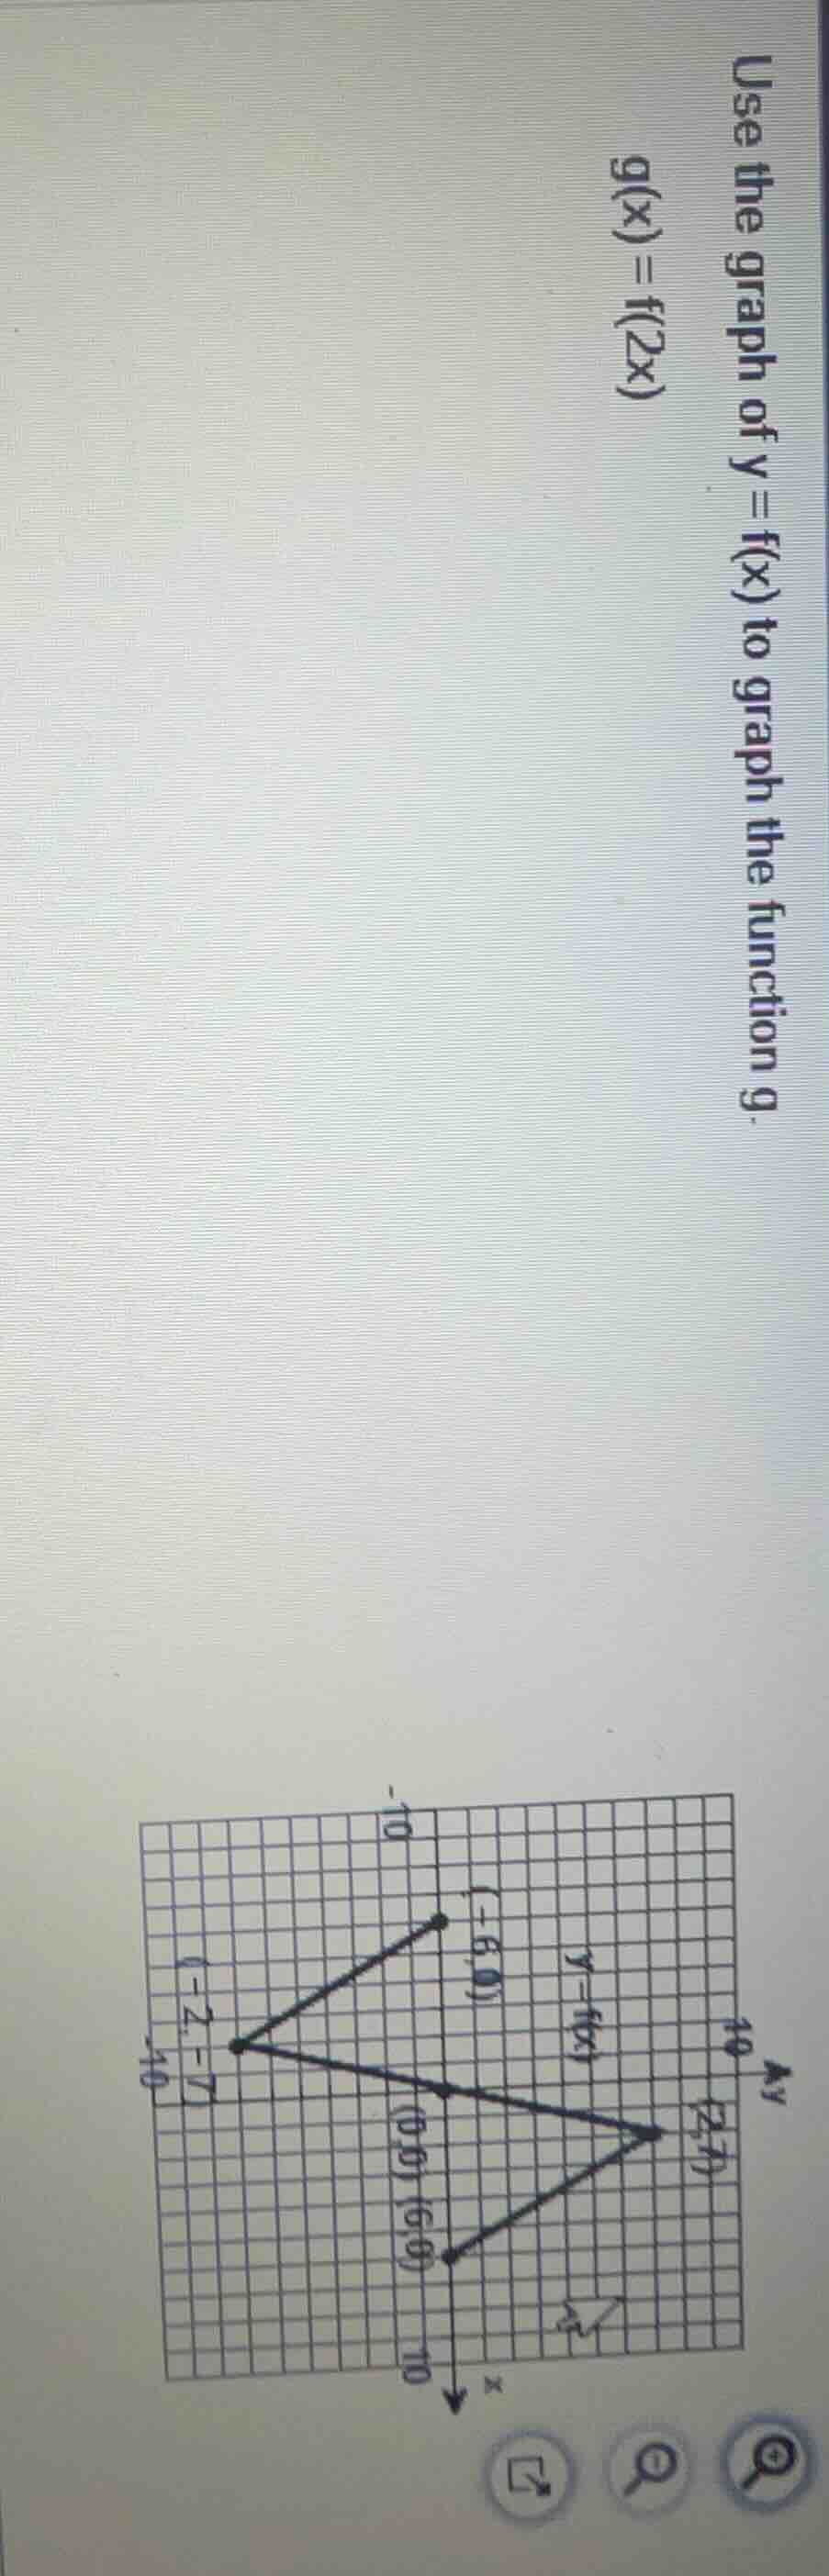
use the graph of ( y = f(x) ) to graph the function ( g ).( g(x) = f(2x) )
Step1: Identify key points of $f(x)$
Key points of $y=f(x)$: $(-6, 0)$, $(-2, -7)$, $(0, 0)$, $(6, 0)$, $(8, 7)$
Step2: Apply horizontal compression rule
For $g(x)=f(2x)$, replace $x$ with $2x$: solve $2x = x_{\text{original}}$, so $x_{\text{new}}=\frac{x_{\text{original}}}{2}$, $y_{\text{new}}=y_{\text{original}}$.
Calculate new points:
- $\frac{-6}{2}=-3$, point: $(-3, 0)$
- $\frac{-2}{2}=-1$, point: $(-1, -7)$
- $\frac{0}{2}=0$, point: $(0, 0)$
- $\frac{6}{2}=3$, point: $(3, 0)$
- $\frac{8}{2}=4$, point: $(4, 7)$
Step3: Plot and connect new points
Plot $(-3,0)$, $(-1,-7)$, $(0,0)$, $(3,0)$, $(4,7)$; connect in order.

Snap & solve any problem in the app
Get step-by-step solutions on Sovi AI
Photo-based solutions with guided steps
Explore more problems and detailed explanations
The graph of $g(x)=f(2x)$ is a horizontal compression of $y=f(x)$ by a factor of $\frac{1}{2}$, with key points $(-3, 0)$, $(-1, -7)$, $(0, 0)$, $(3, 0)$, $(4, 7)$ connected sequentially.