QUESTION IMAGE
Question
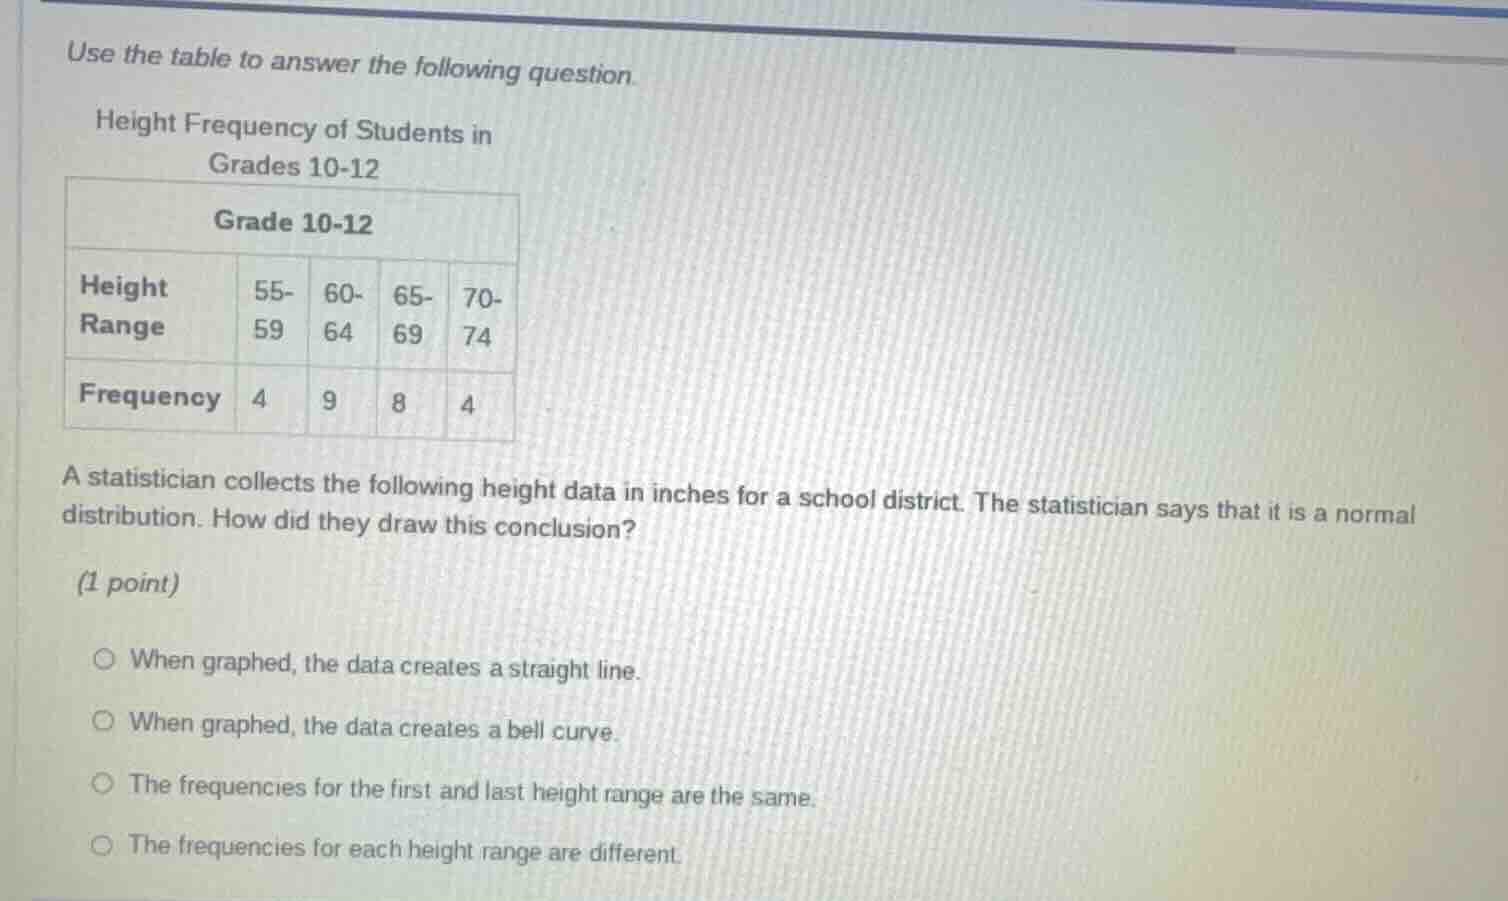
use the table to answer the following question.
height frequency of students in
grades 10-12
grade 10-12
height range: 55-59, 60-64, 65-69, 70-74
frequency: 4, 9, 8, 4
a statistician collects the following height data in inches for a school district. the statistician says that it is a normal distribution. how did they draw this conclusion?
(1 point)
○ when graphed, the data creates a straight line.
○ when graphed, the data creates a bell curve.
○ the frequencies for the first and last height range are the same.
○ the frequencies for each height range are different.
A normal distribution is defined by its characteristic bell-shaped graph when frequencies are plotted against the variable (here, height ranges). The given frequency data (4, 9, 8, 4) shows low frequencies at the extreme height ranges, peaking at the middle range, which aligns with the bell curve shape of a normal distribution. The other options are incorrect: a straight line is not a normal distribution, matching first/last frequencies alone does not confirm normality, and differing frequencies do not define a normal distribution.

Snap & solve any problem in the app
Get step-by-step solutions on Sovi AI
Photo-based solutions with guided steps
Explore more problems and detailed explanations
When graphed, the data creates a bell curve.