QUESTION IMAGE
Question
using measures of center and variability to compare data tutorial level 6
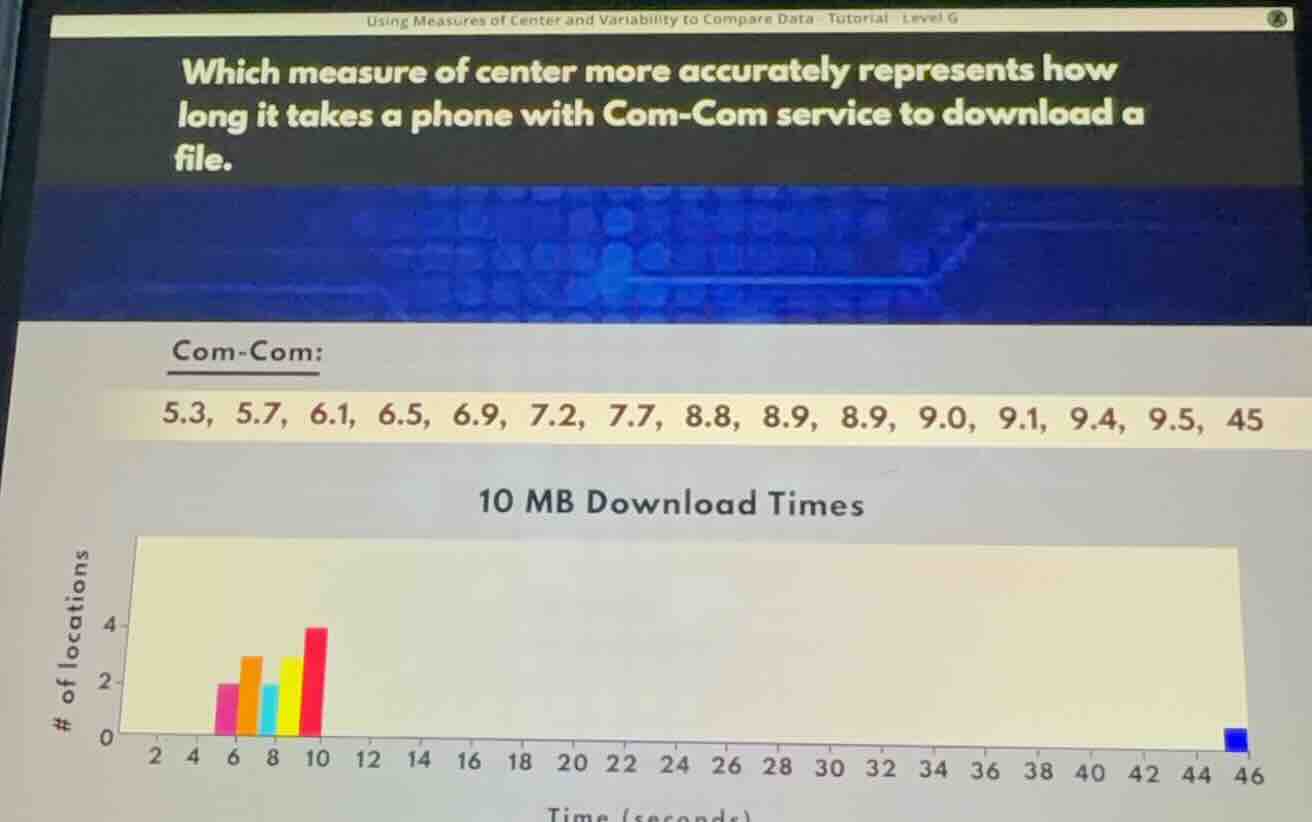
which measure of center more accurately represents how
long it takes a phone with com - com service to download a
file.
com - com:
5.3, 5.7, 6.1, 6.5, 6.9, 7.2, 7.7, 8.8, 8.9, 8.9, 9.0, 9.1, 9.4, 9.5, 45
10 mb download times
of locations
0 2 4 6 8 10 12 14 16 18 20 22 24 26 28 30 32 34 36 38 40 42 44 46
Step1: Identify outlier in data
The value 45 is an extreme outlier, far from other data points (all others are between 5.3 and 9.5).
Step2: Analyze mean sensitivity to outliers
Calculate the mean:
$$\text{Mean} = \frac{5.3 + 5.7 + 6.1 + 6.5 + 6.9 + 7.2 + 7.7 + 8.8 + 8.9 + 8.9 + 9.0 + 9.1 + 9.4 + 9.5 + 45}{15}$$
$$= \frac{152.0}{15} \approx 10.13$$
This mean is pulled upward by the outlier, not representative of typical values.
Step3: Analyze median resistance to outliers
Arrange data, find the 8th value (middle of 15 points):
Sorted data: 5.3, 5.7, 6.1, 6.5, 6.9, 7.2, 7.7, 8.8, 8.9, 8.9, 9.0, 9.1, 9.4, 9.5, 45
Median = 8.8, which reflects the typical cluster of values.

Snap & solve any problem in the app
Get step-by-step solutions on Sovi AI
Photo-based solutions with guided steps
Explore more problems and detailed explanations
The median (8.8 seconds) more accurately represents the typical download time, as the mean is skewed upward by the outlier value of 45 seconds.